
Fig. 6
- ID
- ZDB-FIG-230710-53
- Publication
- Lo et al., 2021 - Cavin4 interacts with Bin1 to promote T-tubule formation and stability in developing skeletal muscle
- Other Figures
- All Figure Page
- Back to All Figure Page
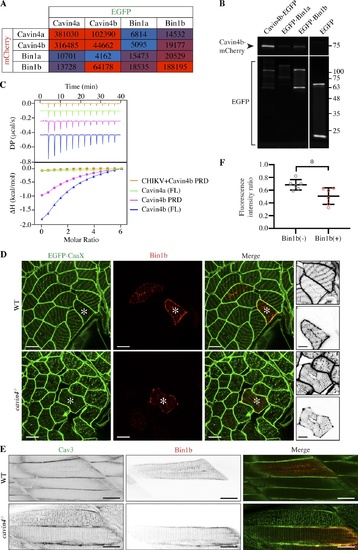
Cavin4b interacts with Bin1b, and high expression of Bin1b can ameliorate abnormal T-tubule morphology in cavin4−/− muscle. (A) Cell-free expression in Leishmania extracts coupled with AlphaLISA showing pairwise comparison of binding between mCherry- and EGFP-tagged Cavin4a, Cavin4b, Bin1a, and Bin1b. Red, positive interaction; blue, no interaction. An arbitrary threshold of 10,000 counts per second of AlphaLISA signal was chosen as the cutoff for a positive interaction. (B) Pull-down using GFPtrap with a maltose-binding protein tag with in-gel fluorescence detection after semi-denaturing PAGE. Cavin4b-mCherry was coexpressed with Cavin4b-EGFP (positive control), EGFP-Bin1a, EGFP-Bin1b, or EGFP (reporter only negative control) in BHK cells. Proteins appear as a doublet due to binding to maltose. Representative blot from three replicates. Molecular weight (kDa) shown on right. See Fig. S5 G for entire gel. (C) ITC measurement of Bin1b-SH3 domain with FL Cavin4a, FL Cavin4b, or Cavin4b PRD. Competitive inhibition of Bin1b-SH3/Cavin4b PRD binding was observed by addition of CHIKV PRD. Three replicates performed. (D) Confocal images of EGFP-CaaX in transverse sections of WT and cavin4−/− skeletal muscle with transient expression of mKate2-Bin1b. Scale bars: 10 µm. Asterisks indicate corresponding muscle fibers; inverted images show a magnification of these fibers (top: EGFP-CaaX; bottom: mKate2-Bin1b; scale bars: 5 µm). (E) Live imaging of Cav3-EGFP in 5-dpf WT and cavin4−/− embryos with transient expression of mKate2-Bin1b (single channels shown as inverted images). Scale bars: 20 µm. (F) Ratio of T-tubule to sarcolemma fluorescence intensity in Bin1b-negative (−) and Bin1b-positive (+) cavin4−/− muscle fibers (n = 6 cavin4−/− embryos from two independent clutches; two-tailed t test). Colored circles represent individual muscle fibers. *, P ≤ 0.05. Error bars represent mean ± SD. |