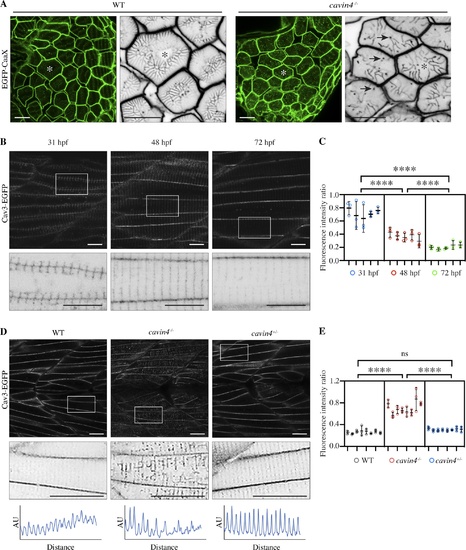
Cavin4−/− zebrafish embryos have an aberrant T-system and increased association of Cav3 with T-tubules. (A) Confocal images of EGFP-CaaX in transverse sections of WT and cavin4−/− 5-dpf embryos. Asterisk indicates corresponding muscle fiber in magnified inverted image. Arrows indicate abnormal puncta in cavin4−/− muscle. Scale bars: 10 µm. (B) Confocal images of Cav3-EGFP in live zebrafish embryos at 31, 48, and 72 hpf. Inverted images in bottom panel show boxed areas. Scale bars: 10 µm. (C) Ratio of T-tubule to sarcolemma fluorescence intensity (n = 5 embryos for each time point in B, n = 3 areas per embryo represented as colored circles; nested one-way ANOVA with multiple-comparison Tukey’s test). ****, P ≤ 0.0001. (D) Confocal images of Cav3-EGFP in live 5-dpf WT, cavin4−/−, and cavin4+/− (sibling) embryos. Inverted images show magnification of boxed areas. Box scan quantitation of boxed area (bottom panel; AU, arbitrary units) highlights loss of T-tubule periodicity in cavin4−/− muscle. Scale bars: 10 µm. (E) Ratio of T-tubule to sarcolemma fluorescence intensity in WT, cavin4−/−, and cavin4+/− muscle fibers (n = 8 embryos per genotype from two independent clutches, n = 3 areas per embryo represented as colored circles; nested one-way ANOVA with multiple-comparison Tukey’s test). ****, P ≤ 0.0001. Error bars represent mean ± SD.
|
