
- Title
-
Cavin4 interacts with Bin1 to promote T-tubule formation and stability in developing skeletal muscle
- Authors
- Lo, H.P., Lim, Y.W., Xiong, Z., Martel, N., Ferguson, C., Ariotti, N., Giacomotto, J., Rae, J., Floetenmeyer, M., Moradi, S.V., Gao, Y., Tillu, V.A., Xia, D., Wang, H., Rahnama, S., Nixon, S.J., Bastiani, M., Day, R.D., Smith, K.A., Palpant, N.J., Johnston, W.A., Alexandrov, K., Collins, B.M., Hall, T.E., Parton, R.G.
- Source
- Full text @ J. Cell Biol.
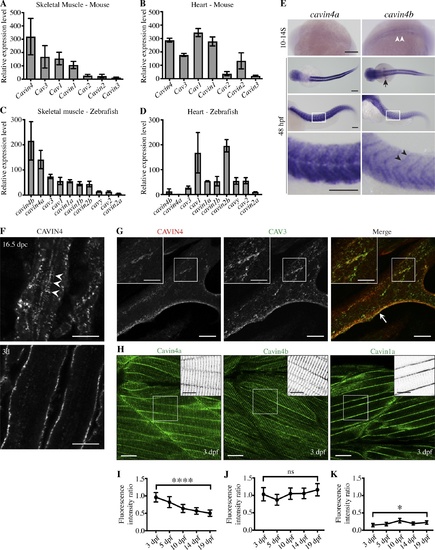
Cavin4 is associated with T-tubules of developing muscle fibers. (A and B) qRT-PCR of caveola-associated genes (relative to 36B4) in 6-mo-old adult WT mouse skeletal muscle (A) and heart tissue (B; mean± SD; n = 3 each for muscle and heart). Reactions were performed in the following groups: Cav1 and Cavin1; Cav2 and Cav3; Cavin2, Cavin3, and Cavin4. (C and D) qRT-PCR of caveola-associated genes (relative to β-actin) in 10-mo-old WT adult zebrafish trunk muscle (C) and heart (D; n = 3 for trunk muscle, n = 3 pooled samples for heart tissue). For A–D, muscle genes are shown in order of decreasing expression; heart genes are shown in the same order as for muscle samples. (E) Whole-mount ISH for cavin4a and cavin4b in 10- to 14-somite (S) and 48-hpf WT zebrafish embryos. Cavin4b expression in adaxial cells (white arrowheads), pectoral fin buds (arrow), and somite boundaries (black arrowheads) is highlighted. Images for 48 hpf shown anterior to left in both dorsal and lateral view; bottom panel shows a magnification of boxed areas. Scale bars: 200 µm. (F) Confocal images of CAVIN4 in mouse skeletal muscle before birth (16.5 dpc) and 3 d after birth (3d). Arrowheads indicate internal labeling. Scale bars: 10 µm. (G) Confocal images of CAVIN4 and CAV3 in C2C12 myotubes (arrow, sarcolemmal staining). Insets show a magnification of boxed area. Scale bars: 20 µm (inset, 10 µm). (H) Clover-tagged Cavin4a, Cavin4b, and Cavin1a in muscle fibers of 3-dpf transgenic zebrafish embryos. Inverted images = magnification of boxed area. Scale bars: 20 µm (inset, 10 µm). (I–K) Ratio of T-tubule to sarcolemmal fluorescence intensity for Cavin4a (I), Cavin4b (J), and Cavin1a (K). n = 9 muscle fibers from three embryos per line for each developmental stage (one-way ANOVA with multiple-comparison Tukey’s test). ****, P ≤ 0.0001; *, P ≤ 0.05. Error bars represent mean ± SD. EXPRESSION / LABELING:
|
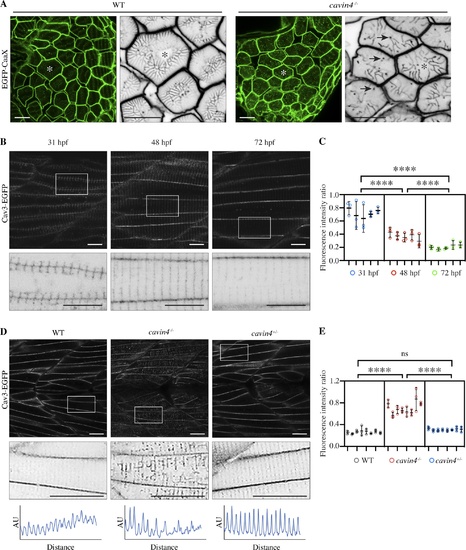
Cavin4−/− zebrafish embryos have an aberrant T-system and increased association of Cav3 with T-tubules. (A) Confocal images of EGFP-CaaX in transverse sections of WT and cavin4−/− 5-dpf embryos. Asterisk indicates corresponding muscle fiber in magnified inverted image. Arrows indicate abnormal puncta in cavin4−/− muscle. Scale bars: 10 µm. (B) Confocal images of Cav3-EGFP in live zebrafish embryos at 31, 48, and 72 hpf. Inverted images in bottom panel show boxed areas. Scale bars: 10 µm. (C) Ratio of T-tubule to sarcolemma fluorescence intensity (n = 5 embryos for each time point in B, n = 3 areas per embryo represented as colored circles; nested one-way ANOVA with multiple-comparison Tukey’s test). ****, P ≤ 0.0001. (D) Confocal images of Cav3-EGFP in live 5-dpf WT, cavin4−/−, and cavin4+/− (sibling) embryos. Inverted images show magnification of boxed areas. Box scan quantitation of boxed area (bottom panel; AU, arbitrary units) highlights loss of T-tubule periodicity in cavin4−/− muscle. Scale bars: 10 µm. (E) Ratio of T-tubule to sarcolemma fluorescence intensity in WT, cavin4−/−, and cavin4+/− muscle fibers (n = 8 embryos per genotype from two independent clutches, n = 3 areas per embryo represented as colored circles; nested one-way ANOVA with multiple-comparison Tukey’s test). ****, P ≤ 0.0001. Error bars represent mean ± SD. |

EM reveals T-tubule irregularities in cavin4−/− zebrafish muscle, which are associated with a reduced Ca2+ response to muscle contraction. (A and B) Ultrastructure of 5-dpf WT (A) and cavin4−/− (B) embryos. Normal sarcomeric T-system structure was observed in WT muscle; arrowheads highlight abundant caveolae. Few caveolae were observed in cavin4−/− muscle. Scale bars: 1 µm. (C) Relative caveolae density was 40.3 ± 14.7% in muscle from 5-dpf cavin4−/− embryos (compared with WT; two-tailed t test). **, P ≤ 0.01. Quantitation performed on randomly selected images from three embryos from three different clutches. (D–K) Single sections showing skeletal muscle ultrastructure from a 5-dpf WT (D) and cavin4−/− zebrafish embryo (H). A single muscle fiber from each WT and cavin4−/− section was chosen (E and I, boxed areas in D and H, respectively), and density-based thresholding was used to segment T-tubules. 3D reconstruction highlights normal radial distribution of T-tubules in WT muscle (F and G) and abnormal T-tubule morphology in cavin4−/− muscle (J and K). Scale bars: 2 µm. (L and M) Remaining T-tubules in cavin4−/− muscle fibers had caveolar structure (arrows). Scale bars: 1 µm. (N) 3D reconstruction of T-tubule area from cavin4−/− muscle. Inset (N') represents boxed area. Scale bar: 500 nm. See also Video 1. (O) Confocal image of GCaMP expression in WT zebrafish muscle, with line scan measurement (dashed line) of GCaMP intensity in response to electrical stimulation (GFP intensity [y axis] over time [seconds, x axis]). Scale bar: 20 µm. (P and Q) Quantitation of GCaMP signal in response to electrical stimulation measured as half-life (Thalf) decay (P) and amplitude (Q, ΔF/F) in WT and cavin4−/− muscle fibers (two-tailed t test). **, P ≤ 0.01. Values for individual embryos shown as colored circles (n = 6, 5, and 2 each of WT and cavin4−/− embryos from three independent clutches, with an average of at least three fiber measurements per embryo). Error bars represent mean ± SD. EXPRESSION / LABELING:
PHENOTYPE:
|
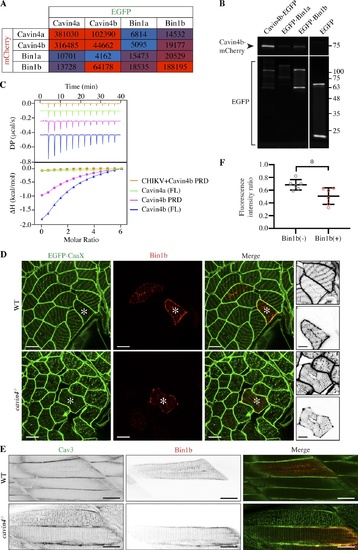
Cavin4b interacts with Bin1b, and high expression of Bin1b can ameliorate abnormal T-tubule morphology in cavin4−/− muscle. (A) Cell-free expression in Leishmania extracts coupled with AlphaLISA showing pairwise comparison of binding between mCherry- and EGFP-tagged Cavin4a, Cavin4b, Bin1a, and Bin1b. Red, positive interaction; blue, no interaction. An arbitrary threshold of 10,000 counts per second of AlphaLISA signal was chosen as the cutoff for a positive interaction. (B) Pull-down using GFPtrap with a maltose-binding protein tag with in-gel fluorescence detection after semi-denaturing PAGE. Cavin4b-mCherry was coexpressed with Cavin4b-EGFP (positive control), EGFP-Bin1a, EGFP-Bin1b, or EGFP (reporter only negative control) in BHK cells. Proteins appear as a doublet due to binding to maltose. Representative blot from three replicates. Molecular weight (kDa) shown on right. See Fig. S5 G for entire gel. (C) ITC measurement of Bin1b-SH3 domain with FL Cavin4a, FL Cavin4b, or Cavin4b PRD. Competitive inhibition of Bin1b-SH3/Cavin4b PRD binding was observed by addition of CHIKV PRD. Three replicates performed. (D) Confocal images of EGFP-CaaX in transverse sections of WT and cavin4−/− skeletal muscle with transient expression of mKate2-Bin1b. Scale bars: 10 µm. Asterisks indicate corresponding muscle fibers; inverted images show a magnification of these fibers (top: EGFP-CaaX; bottom: mKate2-Bin1b; scale bars: 5 µm). (E) Live imaging of Cav3-EGFP in 5-dpf WT and cavin4−/− embryos with transient expression of mKate2-Bin1b (single channels shown as inverted images). Scale bars: 20 µm. (F) Ratio of T-tubule to sarcolemma fluorescence intensity in Bin1b-negative (−) and Bin1b-positive (+) cavin4−/− muscle fibers (n = 6 cavin4−/− embryos from two independent clutches; two-tailed t test). Colored circles represent individual muscle fibers. *, P ≤ 0.05. Error bars represent mean ± SD. |