
FIGURE
Figure 6—figure supplement 4.
- ID
- ZDB-FIG-230707-78
- Publication
- Chen et al., 2023 - Defining function of wild-type and three patient specific TP53 mutations in a zebrafish model of embryonal rhabdomyosarcoma
- Other Figures
-
- Figure 1
- Figure 1— supplement 1.
- Figure 1— supplement 2.
- Figure 2.
- Figure 3
- Figure 3—figure supplement 1.
- Figure 3—figure supplement 2.
- Figure 3—figure supplement 3.
- Figure 3—figure supplement 4.
- Figure 4
- Figure 4—figure supplement 1.
- Figure 4—figure supplement 2.
- Figure 4—figure supplement 3.
- Figure 5
- Figure 5—figure supplement 1.
- Figure 5—figure supplement 2.
- Figure 5—figure supplement 3.
- Figure 5—figure supplement 4.
- Figure 6
- Figure 6—figure supplement 1.
- Figure 6—figure supplement 2.
- Figure 6—figure supplement 3.
- Figure 6—figure supplement 4.
- Figure 7
- Figure 7—figure supplement 1.
- All Figure Page
- Back to All Figure Page
Figure 6—figure supplement 4.
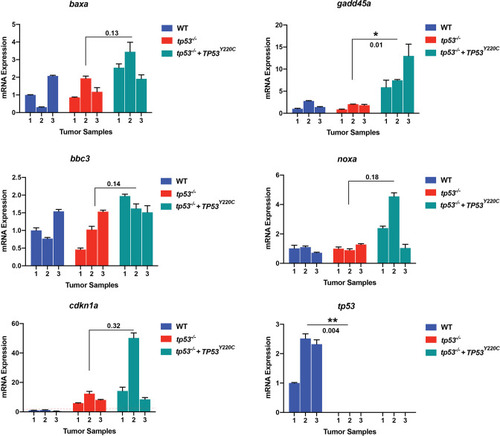
Semi-quantitative qPCR analyses comparing expression of known p53 direct regulated genes Also shown is expression of zebrafish |
Expression Data
Expression Detail
Antibody Labeling
Phenotype Data
Phenotype Detail
Acknowledgments
This image is the copyrighted work of the attributed author or publisher, and
ZFIN has permission only to display this image to its users.
Additional permissions should be obtained from the applicable author or publisher of the image.
Full text @ Elife