
Figure 6
- ID
- ZDB-FIG-230707-74
- Publication
- Chen et al., 2023 - Defining function of wild-type and three patient specific TP53 mutations in a zebrafish model of embryonal rhabdomyosarcoma
- Other Figures
-
- Figure 1
- Figure 1— supplement 1.
- Figure 1— supplement 2.
- Figure 2.
- Figure 3
- Figure 3—figure supplement 1.
- Figure 3—figure supplement 2.
- Figure 3—figure supplement 3.
- Figure 3—figure supplement 4.
- Figure 4
- Figure 4—figure supplement 1.
- Figure 4—figure supplement 2.
- Figure 4—figure supplement 3.
- Figure 5
- Figure 5—figure supplement 1.
- Figure 5—figure supplement 2.
- Figure 5—figure supplement 3.
- Figure 5—figure supplement 4.
- Figure 6
- Figure 6—figure supplement 1.
- Figure 6—figure supplement 2.
- Figure 6—figure supplement 3.
- Figure 6—figure supplement 4.
- Figure 7
- Figure 7—figure supplement 1.
- All Figure Page
- Back to All Figure Page
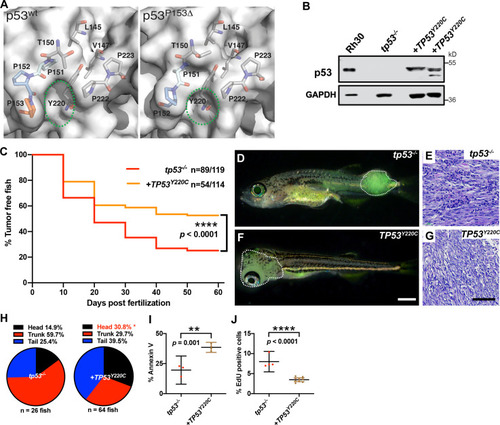
TP53Y220C predisposes to head embryonal rhabdomyosarcoma (ERMS) in zebrafish. (A) Surface representation of p53WT (PDB 2XWR) and p53P153Δ (homology model) showing key residues lining a surface exposed pocket (sticks). The green ovals compare the size and shape of the pocket between the two structures. (B) p53 protein expression levels in tp53-/- fish tumors with or without TP53Y220C, with rhabdomyosarcoma (RMS) cell line, Rh30, as a control. (C) Kaplan–Meier plot showing tumor initiation in tp53-/- fish, with or without TP53Y220C. (D, F) Representative images of tp53-/- fish with ERMS tumors, with or without TP53Y220C (GFP-positive). Dashed region outlines the tumor. The zebrafish in (F) are 35 d. Scale bar in (F) 1 mm. (E, G) Representative H&E staining of tumors in tp53-/- fish, with or without TP53Y220C. Scale bar = 100 µm. (H) Pie chart showing localization of tumors expressed as a percentage found in varying regions of in tp53-/- fish with and without TP53Y220C. Percentage in red indicates a significant difference to tp53-/- (p=0.01928, two-tailed two proportions Z-test). (I) Quantification of Annexin V staining in tumors of tp53-/- fish with or without expression of TP53Y220C. n = 3–4. (J) Quantification of EdU staining in tumors of tp53-/- fish with or without expression of TP53Y220C. n = 4–9. |