
Fig. 4
- ID
- ZDB-FIG-230608-4
- Publication
- Palermo et al., 2023 - Variant-to-gene mapping followed by cross-species genetic screening identifies GPI-anchor biosynthesis as a regulator of sleep
- Other Figures
- All Figure Page
- Back to All Figure Page
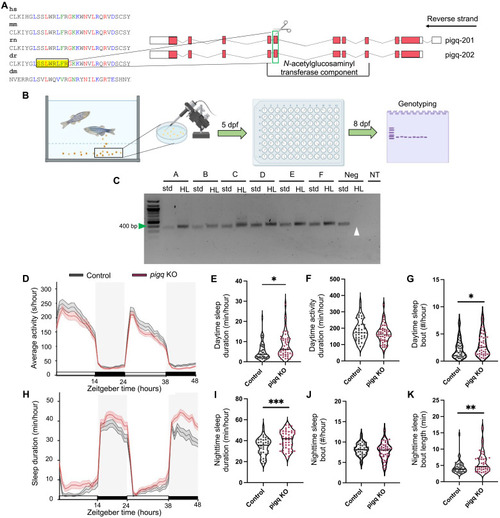
CRISPR mutation of PIG-Q in zebrafish increases sleep.
(A) CRISPR sgRNA design. (B) Schematic of embryo injection and CRISPR mutation confirmation. (C) Representative gel used for genotyping. Green arrow indicates 400 bp on the ladder. Expected PCR product was 366 bp. White arrow indicates wild-type DNA suppression using HL PCR as a negative control. (D) Average (± SEM) activity for 48 hours beginning at lights on (9:00 a.m.). (E) Cumulative daytime sleep across both light periods was increased in PIG-Q KOs (mean difference: 2.83 ± 1.09, t85.2 = 2.59, P = 0.04). (F) No difference was found in daytime activity (mean difference: −19.3 ± 13.01, t88 = 1.48, P = 0.14). (G) Daytime sleep bout number was increased in PIG-Q KOs (mean difference: 0.83 ± 0.40, t88 = 2.06, P = 0.04). (H) Average (± SEM) sleep duration across 48 hours beginning at lights on (9:00 a.m.). (I) Cumulative nighttime sleep duration was increased in PIG-Q KOs across both dark periods (11:00 p.m. to 9:00 a.m.) (mean difference: 6.38 ± 1.82, t88 = 3.5, P = 0.0007). (J and K) Nighttime sleep bout number did not differ between groups [(J) mean difference: −0.41 ± 0.38, t85.2 = 1.08, P = 0.28], but nighttime sleep bout length was increased in PIG-Q KOs [(K) mean difference: 1.60 ± 0.58, t79.7 = 2.75, P = 0.007]. Gray boxes indicate night, while white represents day. N = 42 scramble-injected controls, N = 48 PIG-Q KOs. Independent Student’s t test was used to compare PIG-Q KOs and controls. Welch’s correction was applied to (E), (J), and (K) because unequal variances between groups were determined. *P < 0.05, **P < 0.01, and ***P < 0.001. For (C), samples A to F represent individual larvae samples. Neg, wild-type negative control DNA; std., standard forward and reverse primers; HL, headloop primers; NT, no template; dpf, days post fertilization. |
| Fish: | |
|---|---|
| Knockdown Reagent: | |
| Observed In: | |
| Stage: | Days 7-13 |