
Fig. 2
- ID
- ZDB-FIG-230608-2
- Publication
- Palermo et al., 2023 - Variant-to-gene mapping followed by cross-species genetic screening identifies GPI-anchor biosynthesis as a regulator of sleep
- Other Figures
- All Figure Page
- Back to All Figure Page
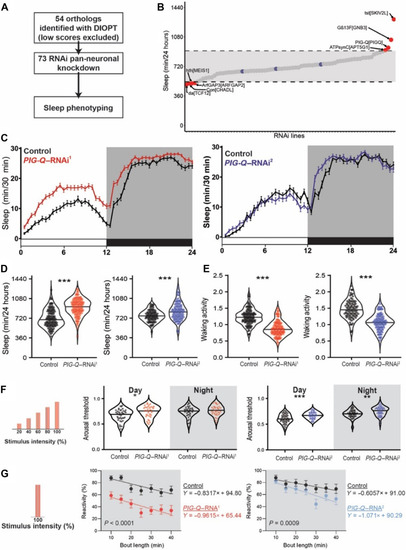
PIG-Q knockdown increases sleep duration and sleep depth.
(A) Design of orthologous gene screen. (B) Total sleep minutes over a 24-hour period in viable RNAi crosses (73 lines, n > 16 per line). Dashed lines and grayed area indicate two SDs from the mean for every animal tested in either direction. Blue dots indicate control sleep responses, while red dots indicate sleep responses of RNAi lines that fall outside two SDs. (C) Sleep profiles of two independent RNAi lines targeting PIG-Q (PIG-Q–RNAi1, red; PIG-Q–RNAi2, blue). (D) Knockdown of PIG-Q significantly increases total sleep (t test, PIG-Q–RNAi1 t260 = 11.42, P < 0.0001; PIG-Q–RNAi2 t184 = 4.282, P < 0.0001). (E) Knockdown of PIG-Q significantly decreases waking activity (t test: PIG-Q–RNAi1 t260 = 11.45, P < 0.0001; PIG-Q–RNAi2 t184 = 11.09, P < 0.0001). (F and G) The Drosophila arousal tracking system records fly movement while simultaneously controlling periodic mechanical stimuli. (F) Arousal threshold was measured on sleeping flies using mechanical stimuli of increasing strength. Knockdown of PIG-Q significantly increases arousal threshold (restricted maximum likelihood: PIG-Q–RNAi1 F1,73 = 4.267, P = 0.0424; PIG-Q–RNAi2 F1,102 = 16.42, P < 0.0001). This occurs during the day for both independent RNAi lines (PIG-Q–RNAi1, P = 0.0127; PIG-Q–RNAi2, P = 0.0002), while an increase in arousal threshold only occurred in one line during the night (PIG-Q–RNAi1, P = 0.4308; PIG-Q–RNAi2, P = 0.0020). (G) Reactivity was measured by assessing the proportion of flies that react to a single mechanical stimulus for each bin of immobility. Knockdown of PIG-Q significantly decreases nighttime reactivity (analysis of covariance with bout length as covariate: PIG-Q–RNAi1, F1,661 = 107.1, P < 0.0001; PIG-Q–RNAi2, F1,594 = 24.87, P < 0.0001). For sleep profiles, error bars represent ± SEM. For violin plots, the median (solid black line) is shown. White background indicates daytime, while gray background indicates nighttime. *P < 0.05, **P < 0.01, and ***P < 0.001. |