
- Title
-
Variant-to-gene mapping followed by cross-species genetic screening identifies GPI-anchor biosynthesis as a regulator of sleep
- Authors
- Palermo, J., Chesi, A., Zimmerman, A., Sonti, S., Pahl, M.C., Lasconi, C., Brown, E.B., Pippin, J.A., Wells, A.D., Doldur-Balli, F., Mazzotti, D.R., Pack, A.I., Gehrman, P.R., Grant, S.F.A., Keene, A.C.
- Source
- Full text @ Sci Adv

Translating human GWAS signals to functional outcomes with variant-to-gene mapping.
(A) Leveraging existing insomnia human GWAS loci, we identified proxy SNPs in strong linkage disequilibrium with sentinel SNPs using both genome-wide ATAC-seq and high-resolution promoter-focused Capture C data from iPSC-derived NPCs and then performed high-throughput sleep and activity screening using Drosophila RNAi lines with confirmation in a vertebrate zebrafish (Danio rerio) model. (B to D) Three examples of chromatin loops linking insomnia associate SNPs to candidate effector genes in NPCs. (B) rs13033745 [coefficient of determination (r2) with sentinel SNP rs1519102 = 0.84] loops to the MEIS1 promoter region. (C) rs9914123 (r2 with sentinel SNP rs11650304 = 0.76) loops to the promoters of SP2, PRR15L, CDK5RAP3, NFE2L1, CBX1, and HOXB3 in a ~700-kb region. (D) rs3752495, rs8062685, and rs9932282 (r2 with sentinel SNP rs3184470 = ~1) loop to the promoters of PIG-Q, NHLRC4, and NME4. Orange box, sentinel SNP. Black bars, open chromatin peaks from ATAC-seq. Magenta arcs, chromatin loops from promoter-focused Capture C. Neuronal enhancer and promoter tracks are from (81). |
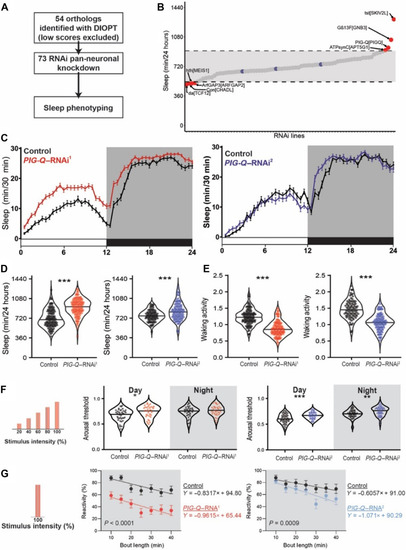
PIG-Q knockdown increases sleep duration and sleep depth.
(A) Design of orthologous gene screen. (B) Total sleep minutes over a 24-hour period in viable RNAi crosses (73 lines, n > 16 per line). Dashed lines and grayed area indicate two SDs from the mean for every animal tested in either direction. Blue dots indicate control sleep responses, while red dots indicate sleep responses of RNAi lines that fall outside two SDs. (C) Sleep profiles of two independent RNAi lines targeting PIG-Q (PIG-Q–RNAi1, red; PIG-Q–RNAi2, blue). (D) Knockdown of PIG-Q significantly increases total sleep (t test, PIG-Q–RNAi1 t260 = 11.42, P < 0.0001; PIG-Q–RNAi2 t184 = 4.282, P < 0.0001). (E) Knockdown of PIG-Q significantly decreases waking activity (t test: PIG-Q–RNAi1 t260 = 11.45, P < 0.0001; PIG-Q–RNAi2 t184 = 11.09, P < 0.0001). (F and G) The Drosophila arousal tracking system records fly movement while simultaneously controlling periodic mechanical stimuli. (F) Arousal threshold was measured on sleeping flies using mechanical stimuli of increasing strength. Knockdown of PIG-Q significantly increases arousal threshold (restricted maximum likelihood: PIG-Q–RNAi1 F1,73 = 4.267, P = 0.0424; PIG-Q–RNAi2 F1,102 = 16.42, P < 0.0001). This occurs during the day for both independent RNAi lines (PIG-Q–RNAi1, P = 0.0127; PIG-Q–RNAi2, P = 0.0002), while an increase in arousal threshold only occurred in one line during the night (PIG-Q–RNAi1, P = 0.4308; PIG-Q–RNAi2, P = 0.0020). (G) Reactivity was measured by assessing the proportion of flies that react to a single mechanical stimulus for each bin of immobility. Knockdown of PIG-Q significantly decreases nighttime reactivity (analysis of covariance with bout length as covariate: PIG-Q–RNAi1, F1,661 = 107.1, P < 0.0001; PIG-Q–RNAi2, F1,594 = 24.87, P < 0.0001). For sleep profiles, error bars represent ± SEM. For violin plots, the median (solid black line) is shown. White background indicates daytime, while gray background indicates nighttime. *P < 0.05, **P < 0.01, and ***P < 0.001. |
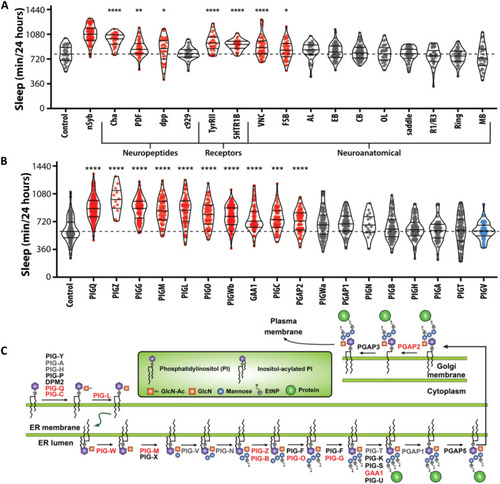
Localization of PIG-Q and characterization of the GPI-anchor biosynthesis genes in sleep regulation.
(A) Knockdown of PIG-Q in multiple Drosophila neuronal subpopulations affects sleep duration (ANOVA: F18,756 = 25.21, P < 0.0001). The dashed line represents the mean of the control line. PIG-Q significant increased sleep when knocked down pan-neuronally (nSyb; P < 0.0001); cholinergic neurons (Cha; P < 0.0001); dpp-expressing neurons (dpp; P = 0.0334); circadian pacemaker neurons (PDF; P = 0.0025); tyramine II receptor neurons (TyRII; P < 0.0001); serotonin receptor IB neurons (5HT1b; P < 0.0001); the ventral nerve cord (VNC; P < 0.0001); and the fan-shaped body (fsb; P = 0.0478). (B) Knockdown of multiple genes in the PIG pathway affects sleep duration (ANOVA: F18,1251 = 39.63, P < 0.0001). The dashed line indicates the mean of the control line. For violin plots, the median and 25th and 75th percentiles are shown (solid black lines). Each dot represents an individual fly; red indicates sleep duration that is significantly higher than the control, gray indicates sleep that is not significantly different, and blue indicates sleep that is significantly lower than the control as revealed by Dunnett’s multiple comparisons test. *P < 0.05, **P < 0.01, ***P < 0.001, and ****P < 0.0001. (C) PIG anchor biosynthesis pathway. Genes highlighted in red represent genes that show long sleep phenotypes when knocked down pan-neuronally in Drosophila as described below, while genes in gray exhibited no or short sleep phenotype. Genes in black were untested because there were no available RNAi lines. |
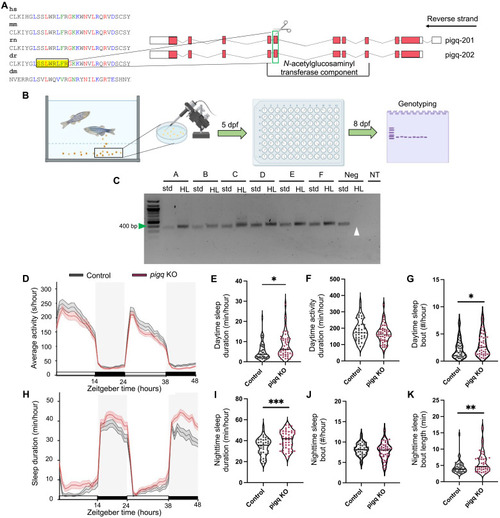
CRISPR mutation of PIG-Q in zebrafish increases sleep.
(A) CRISPR sgRNA design. (B) Schematic of embryo injection and CRISPR mutation confirmation. (C) Representative gel used for genotyping. Green arrow indicates 400 bp on the ladder. Expected PCR product was 366 bp. White arrow indicates wild-type DNA suppression using HL PCR as a negative control. (D) Average (± SEM) activity for 48 hours beginning at lights on (9:00 a.m.). (E) Cumulative daytime sleep across both light periods was increased in PIG-Q KOs (mean difference: 2.83 ± 1.09, t85.2 = 2.59, P = 0.04). (F) No difference was found in daytime activity (mean difference: −19.3 ± 13.01, t88 = 1.48, P = 0.14). (G) Daytime sleep bout number was increased in PIG-Q KOs (mean difference: 0.83 ± 0.40, t88 = 2.06, P = 0.04). (H) Average (± SEM) sleep duration across 48 hours beginning at lights on (9:00 a.m.). (I) Cumulative nighttime sleep duration was increased in PIG-Q KOs across both dark periods (11:00 p.m. to 9:00 a.m.) (mean difference: 6.38 ± 1.82, t88 = 3.5, P = 0.0007). (J and K) Nighttime sleep bout number did not differ between groups [(J) mean difference: −0.41 ± 0.38, t85.2 = 1.08, P = 0.28], but nighttime sleep bout length was increased in PIG-Q KOs [(K) mean difference: 1.60 ± 0.58, t79.7 = 2.75, P = 0.007]. Gray boxes indicate night, while white represents day. N = 42 scramble-injected controls, N = 48 PIG-Q KOs. Independent Student’s t test was used to compare PIG-Q KOs and controls. Welch’s correction was applied to (E), (J), and (K) because unequal variances between groups were determined. *P < 0.05, **P < 0.01, and ***P < 0.001. For (C), samples A to F represent individual larvae samples. Neg, wild-type negative control DNA; std., standard forward and reverse primers; HL, headloop primers; NT, no template; dpf, days post fertilization. PHENOTYPE:
|