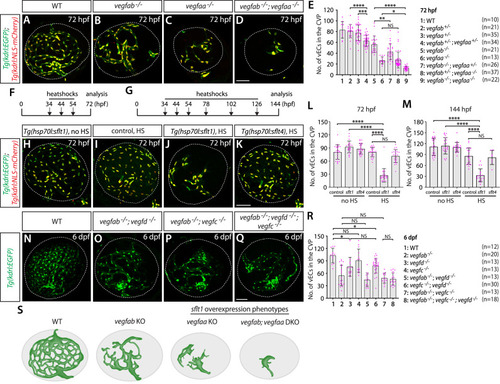
Zebrafish Vegfa paralogs are redundantly required for fenestrated choroidal vascular plexus (CVP) formation.
(A–D) Wild-type (WT) (A), vegfab-/- (B), vegfaa-/- (C), and vegfab-/-;vegfaa-/- (D) CVP visualized by Tg(kdrl:EGFP) and Tg(kdrl:NLS-mCherry) expression at 72 hours post fertilization (hpf). (E) Quantification of the number of vascular endothelial cells (vECs) that comprise the CVP at 72 hpf (the number of animals examined per genotype is listed in the panel). Zebrafish vegfa paralogs genetically interacted in fenestrated CVP formation. (F, G) Time course of the heatshock (HS) experiments for panels (H–M). (H–K) The CVP of 72 hpf Tg(hsp70l:sflt1) (H, J), Tg(hsp70l:sflt4) (K), and their control sibling (I) larvae that carried both the Tg(kdrl:EGFP) and Tg(kdrl:NLS-mCherry) transgenes after treatment with (I–K) and without (H) multiple HS. HS-induced overexpression of sFlt1 led to pronounced reductions in the number of vECs constituting the CVP (J). (L, M) Quantification of the number of vECs that comprise the CVP at 72 (L) and 144 (M) hpf with and without HS treatments. The number of animals examined per treatment at 72 hpf: without HS treatment, n=23 for control, n=21 for sflt1, and n=25 for sflt4; with HS treatment, n=23 for control, n=24 for sflt1, and n=23 for sflt4. The number of animals examined at 144 hpf: without HS treatment, n=22 for control, n=21 for sflt1, and n=20 for sflt4; with HS treatment, n=20 for control, n=28 for sflt1, and n=24 for sflt4. (N–Q) WT (N), vegfab-/-;vegfd-/- (O), vegfab-/-;vegfc-/- (P), and vegfab-/-;vegfd-/-;vegfc-/- (Q) CVP visualized by Tg(kdrl:EGFP) expression at 6 days post fertilization (dpf). (R) Quantification of the number of vECs that comprise the CVP at 6 dpf (the number of animals examined per genotype is listed in the panel). Refer to Figure 10—source data 1 for the precise cell counts of individual larvae. (S) Schematic representations of the CVP phenotypes observed in vegfa mutants and after sFlt1 overexpression at 72 hpf. Temporal inhibition of Vegfa signaling by sFlt1 overexpression recapitulated the severely impaired CVP phenotypes observed in genetic mutants. In panels (E), (L), (M), and (R), each data point shown in magenta represents individual animal’s quantification, and values represent means ± SD (*, **, ***, and **** indicate p<0.05, p<0.01, p<0.001, and p<0.0001, respectively, by one-way analysis of variance [ANOVA] followed by Tukey’s HSD test). Scale bars: 50 µm in (D) for (A–D), in (K) for (H–K), in (Q) for (N–Q).
Quantification of the number of endothelial cells that comprised the choroidal vascular plexus (CVP) in wild-type (WT) and various <italic toggle='yes'>vegf</italic> mutants at 6 days post fertilization (dpf).
Expression Data
Expression Detail
Antibody Labeling
Phenotype Data
Phenotype Detail
Acknowledgments
This image is the copyrighted work of the attributed author or publisher, and
ZFIN has permission only to display this image to its users.
Additional permissions should be obtained from the applicable author or publisher of the image.
Full text @ Elife
Your Input Welcome
Thank you for submitting comments. Your input has been emailed to ZFIN curators who may contact you if
additional information is required.
Oops. Something went wrong. Please try again later.