|
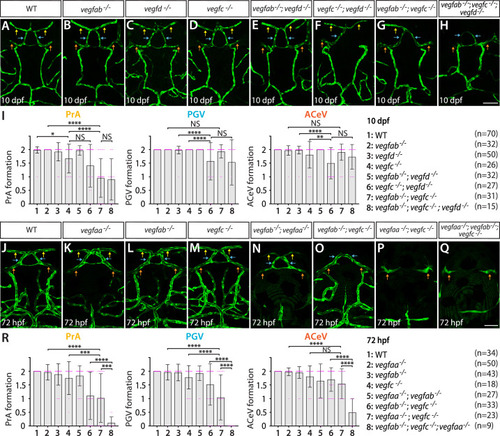
Heterogeneous endothelial requirements for Vegfs-dependent angiogenesis at the diencephalic choroid plexus (dCP)/pineal gland (PG) interface. (A–H) Dorsal views of 10 days post fertilization (dpf) wild-type (WT) (A), vegfab-/- (B), vegfd-/- (C), vegfc-/- (D), vegfab-/-;vegfd-/- (E), vegfc-/-;vegfd-/- (F), vegfab-/-;vegfc-/- (G), and vegfab-/-;vegfc-/-;vegfd-/- (H) cranial vasculature visualized by Tg(kdrl:EGFP) expression. Yellow arrows point to the prosencephalic artery (PrA), blue arrows to the PG vessel (PGV), and orange arrows to the anterior cerebral vein (ACeV). A majority of vegfab-/-;vegfc-/- (G) and vegfab-/-;vegfc-/-;vegfd-/- (H) larvae lacked the PrA at either or both sides. vegfc-/-;vegfd-/- (F) and vegfab-/-;vegfc-/-;vegfd-/- (H), but not vegfab-/-;vegfc-/- (G), larvae displayed partially penetrant defects in PGV and/or ACeV formation. (I) Quantification of PrA, PGV, and ACeV formation at 10 dpf (the number of animals examined per genotype is listed in the panel). Statistical data support genetic interactions between vegfab and vegfc in PrA formation and between vegfd and vegfc in PGV and ACeV formation. No significant contributions of vegfd or vegfab to the formation of the PrA or PGV/ACeV, respectively, were noted. (J–Q) Dorsal views of 72 hours post fertilization (hpf) WT (J), vegfaa-/- (K), vegfab-/- (L), vegfc-/- (M), vegfab-/-;vegfaa-/- (N), vegfab-/-;vegfc-/- (O), vegfaa-/-;vegfc-/- (P), and vegfaa-/-;vegfab-/-;vegfc-/- (Q) cranial vasculature visualized by Tg(kdrl:EGFP) expression. Yellow arrows point to the PrA, blue arrows to the PGV, and orange arrows to the ACeV. vegfab-/-;vegfc-/-, but not their respective single mutants, exhibited pronounced PrA formation deficits. vegfaa-/- and vegfab-/-;vegfaa-/- displayed severe defects in mesencephalic vein (MsV) formation without a deficit in PrA, PGV, or ACeV development. vegfaa-/-;vegfc-/- and vegfaa-/-;vegfab-/-;vegfc-/- larvae exhibited a severe loss of the PrA and PGV. (R) Quantification of PrA, PGV, and ACeV formation at 72 hpf (the number of animals examined per genotype is listed in the panel). Statistical data support genetic interactions between vegfab and vegfc in PrA formation and between vegfaa and vegfc in PrA and PGV formation. Furthermore, significant genetic interactions among these three genes were detected in vascularization at this interface. In panels (I and R), each data point shown in magenta represents individual animal’s vessel formation score, and values represent means ± SD (*, **, ***, and **** indicate p<0.05, p<0.01, p<0.001, and p<0.0001, respectively, by one-way analysis of variance [ANOVA] followed by Tukey’s HSD test). Scale bars: 50 µm in (H) for (A–H) and in (Q) for (J–Q).
|