FIGURE SUMMARY
Title

Local angiogenic interplay of Vegfc/d and Vegfa controls brain region-specific emergence of fenestrated capillaries

Authors
Parab, S., Card, O.A., Chen, Q., America, M., Buck, L.D., Quick, R.E., Horrigan, W.F., Levkowitz, G., Vanhollebeke, B., Matsuoka, R.L.
Source
Full text @ Elife

Characterization of endothelial marker and β-catenin reporter expression in zebrafish larval brain vasculature.

(A–A”) Dorsal views of a 10 days post fertilization (dpf) Tg(plvap:EGFP) zebrafish head immunostained for Glut1, an endothelial marker for the blood-brain barrier (BBB) state. Tg(plvap:EGFP)+ blood vessels formed in the diencephalic choroid plexus (dCP) and myelencephalic choroid plexus (mCP) were devoid of Glut1 immunoreactivity. (B–D) Magnified, merged images of the immunostained larva shown in (A”). Glut1 immunoreactivity was mostly detected in Tg(plvap:EGFP)- blood vessels in the meningeal and brain parenchymal compartments. (E–F”’) Dorsal views of the 10 dpf Tg(plvap:EGFP);Tg(glut1b:mCherry) zebrafish heads immunostained for P-glycoprotein (Pgp) shows absent expression of both the Tg(glut1b:mCherry) transgene and Pgp immunoreactivity in the Tg(plvap:EGFP)+ Hy loop (E–E”’). While Pgp immunoreactivity overlapped with most Tg(glut1b:mCherry)+ blood vessels (E’, E”, F’, F”), Tg(plvap:EGFP)+ blood vessels were mostly devoid of Pgp immunoreactivity. Similar to Glut1 immunoreactivity (Figure 2C–D”), a rostral portion of the Tg(plvap:EGFP)+ hypophyseal artery (HyA) in proximity to the organum vasculosum of the lamina terminalis (OVLT) and the palatocerebral arteries (PLA) junction was devoid of both Tg(glut1b:mCherry) transgene expression and Pgp immunoreactivity (F–F”’). (G–K) Magnified, merged images of 6 dpf Tg(fli1:GAL4-Hsa.TCF7L2-2A-mCherry);Tg(UAS:EGFP);Tg(fli1:MYR-mCherry) larvae show endothelial β-catenin reporter expression in hindbrain central arteries (G, arrows). This high level of endothelial β-catenin reporter expression was not detected in strong Tg(plvap:EGFP)+ vasculature which forms in the dCP (H) and mCP (I) as well as in the Hy loop (K) and a rostral portion of the HyA (J). Scale bars: 50 µm in (A”) for (A–A”), in (B–D), and in (G–K); 25 µm in (E”’) for (E–E”’) and in (F”’) for (F–F”’).

Characterization of the reckulb3 allele.

(A) Schematic representation of the domain architecture of Reck, with from N- to C-terminus, five cysteine knot (CK) motifs, a Frizzled-like cysteine-rich domain (CRD), two epidermal growth factor-like domains (EGF-like) and three Kazal-like motifs upstream of a membrane glycosylphosphatidylinositol (GPI) anchor. The CK motifs are implicated in Wnt signaling by binding Gpr124 and Wnt7a/b, while the Kazal motifs control matrix metalloproteinase (MMP) activity. (B) Sequence alignment of wild-type (WT) and mutant Reck sequences, showing the disulfide bonding pattern within the CK motif consensus (6 Cys repeat: C-C-X7-9-C-X3-C-X12-22-C-X9-12-C). The reckulb3 mutant allele was generated by CRISPR-Cas9 mutagenesis at the target site highlighted in blue (see Materials and methods for details). PAM: protospacer adjacent motif. An in-frame mutation allele was selected to interfere selectively with the domains of Reck implicated in Wnt-dependent brain angiogenesis.

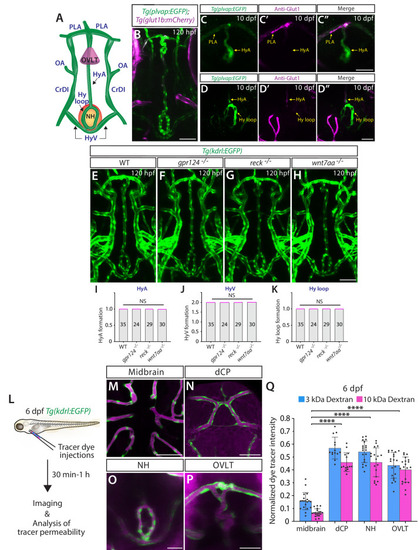
Wnt/β-catenin signaling deficiency does not cause any apparent defect in fenestrated capillary formation in the neurohypophysis (NH) and organum vasculosum of the lamina terminalis (OVLT).

(A) Schematic diagram of vasculature in the ventral brain at around 5–10 days post fertilization (dpf), illustrating the locations of the OVLT, the NH, and distinct blood vessels used for quantifications. HyA: hypophyseal artery, HyV: hypophyseal veins, Hy loop: hypophyseal loop, PLA: palatocerebral arteries, OA: optic artery, CrDI: cranial division of the internal carotid artery. (B) Dorsal view of 120 hours post fertilization (hpf) Tg(plvap:EGFP);Tg(glut1b:mCherry) ventral brain shows strong Tg(plvap:EGFP) expression in the Hy loop, HyA, and PLA compared to its fainter signals in the HyV. (C–D”) Dorsal views of the 10 dpf Tg(plvap:EGFP) head immunostained for Glut1. Glut1 immunoreactivity was undetectable in a rostral portion of the Tg(plvap:EGFP)+ HyA that lies in proximity to the OVLT (C–C”) and in the Tg(plvap:EGFP)+ Hy loop (D–D”). Faint signals were detected in a caudal portion of the HyA that resides close to the Hy loop (D–D”). (E–H) Dorsal views of 120 hpf wild-type (WT) (E), gpr124-/- (F), reck-/- (G), and wnt7aa-/- (H) ventral brain vasculature visualized by Tg(kdrl:EGFP) expression. gpr124-/-, reck-/-, or wnt7aa-/- larvae formed vasculature in the NH/OVLT regions similar to WT. (I–K) Quantification of ventral brain vessel formation at 120 hpf (the number of animals examined per genotype is listed in the panel). No significant difference was detected in gpr124-/-, reck-/-, or wnt7aa-/- larvae compared to WT. Each data point shown in magenta represents individual animal’s vessel formation score. (L) Experimental workflow of tracer dye injections and subsequent imaging and tracer permeability analysis. Tg(kdrl:EGFP) larvae at 6 dpf were co-injected with 3 kDa and 10 kDa dextran dyes conjugated with different fluorophores. (M–P) Merged images of 3 kDa tetramethylrhodamine-conjugated dextran dye (magenta) and Tg(kdrl:EGFP)+ vasculature at 6 dpf. Unlike the midbrain parenchyma (M) where a functional blood-brain barrier (BBB) is established, a higher amount of tracer accumulation was detected in tissues around the diencephalic choroid plexus (dCP), NH, and OVLT brain regions (N–P). (Q) Quantification of normalized tracer intensity across the different brain regions at 6 dpf reveals a significant increase in tracer accumulation around the dCP, NH, and OVLT brain regions compared to the midbrain parenchyma. **** indicates p<0.0001 by one-way analysis of variance (ANOVA) followed by Tukey’s HSD test. Statistical significance was calculated for each dye tracer across different brain regions and represents differences in the graph. Scale bars: 50 µm in (B), in (H) for (E–H), in (M–N); 25 µm in (C”) for (C–C”), in (D”) for (D–D”), in (O–P).

Developmental angiogenesis at the interface of the diencephalic choroid plexus (dCP) and pineal gland (PG), and vegf expression patterns during the vascularization of this interface.

(A) Schematic representation of the dorsal view of the zebrafish larval head at 10 days post fertilization (dpf), indicating the location of the dCP and PG interface (red boxed area). (B–C”’) 3D (B), lateral (B’), and dorsal (C–C”’) views of the 10 dpf Et(cp:EGFP);Tg(kdrl:ras-mCherry) head immunostained for rhodopsin show the 3D spatial relationship between dCP epithelial cells (green), pineal photoreceptor cells (magenta), and blood vessels (white). (D) Dorsal view of 10 dpf Tg(plvap:EGFP);Tg(glut1b:mCherry) head shows strong Tg(plvap:EGFP) and undetectable Tg(glut1b:mCherry) expression in the prosencephalic artery (PrA), PG vessel (PGV), and anterior cerebral vein (ACeV). In contrast, the neighboring vessels mesencephalic vein (MsV) display strong Tg(glut1b:mCherry) expression. (E–E”) Dorsal views of the 75 hours post fertilization (hpf) Et(cp:EGFP) head immunostained for Claudin-5 show EGFP+ dCP epithelial cells (yellow arrows) outlined by the tight junction protein Claudin-5. (F–J) Dorsal views of 23 (F), 26 (G), 32 (H), 48 (I), and 75 (J) hpf Tg(kdrl:EGFP) rostral cranial vasculature show the developmental time courses of vascularization at the dCP/PG interface. (K) Schematic diagram of the vasculature at the dCP/PG interface shows the direction of blood flow at around 75–10 dpf. (L–L”) Dorsal views of a 26 hpf TgBAC(vegfab:EGFP);Tg(kdrl:ras-mCherry) head show TgBAC(vegfab:EGFP)+ cells at the midline where bilateral PrA connect. (M–N”) Dorsal (M–N”) and lateral (M’) views of a 75 hpf TgBAC(vegfab:EGFP);Tg(kdrl:ras-mCherry) head immunostained for Claudin-5. As compared to 26 hpf, an increased number of TgBACvegfab:EGFP + cells was observed at the PrA connection site and in its anterior brain regions (M, M’). Magnified images of the boxed area in (M) indicate TgBAC(vegfab:EGFP)+ and Claudin-5+ dCP epithelial cells (yellow arrows, N–N”). (O–O”) Dorsal views of a 26 hpf TgBAC(vegfc:EGFP);Tg(kdrl:ras-mCherry) head show TgBAC(vegfc:EGFP)+ vascular endothelial cells (vECs, white arrows) and separate cells at the PrA connection site. (P–Q”) Dorsal (P, Q–Q”) and lateral (P’) views of a 75 hpf TgBAC(vegfc:EGFP);Tg(kdrl:ras-mCherry) head immunostained for Claudin-5. TgBAC(vegfc:EGFP)+ cells were observed at the PrA connection site and in its posterior brain regions (P, P’). Magnified images of the boxed area in (P) indicate TgBAC(vegfc:EGFP)+ and Claudin-5+ dCP epithelial cells (yellow arrows, Q–Q”). (R–R”) Dorsal views of a 26 hpf TgBAC(vegfd:EGFP);Tg(kdrl:ras-mCherry) head show TgBAC(vegfd:EGFP)+ meningeal fibroblast-like cells that reside posterior to the dCP/PG interface. TgBAC(vegfd:EGFP)+ axonal projections were also visualized. (S–T”) Dorsal (S, T–T”) and lateral (S’) views of a 75 hpf TgBAC(vegfd:EGFP);Tg(kdrl:ras-mCherry) head immunostained for Claudin-5. TgBAC(vegfd:EGFP)+ cells were observed in meningeal fibroblast-like cells that reside posterior to the PGV/ACeV (S, S’). Magnified images of the boxed area in (S) show no obvious TgBAC(vegfd:EGFP) expression in dCP epithelial cells (T–T”). (U–U”) Dorsal views of a 26 hpf TgBAC(vegfaa:EGFP);Tg(kdrl:ras-mCherry) head show TgBAC(vegfaa:EGFP)+ vECs (white arrows). (V–W”) Dorsal (V, W–W”) and lateral (V’) views of a 75 hpf TgBAC(vegfaa:EGFP);Tg(kdrl:ras-mCherry) head immunostained for Claudin-5. Sparse TgBAC(vegfaa:EGFP)+ cells were observed at the lateral periphery of the dCP (W-W’). Magnified images of the boxed area in (V) show TgBAC(vegfaa:EGFP)+ and Claudin-5+ dCP epithelial cells at the periphery (W-W’). Scale bars: 30 µm in (B), (B’), (D), in (C”’) for (C–C”’), in (E”) for (E–E”), in (V’) for (M’), (P’), (S’); 50 µm in (F–J), in (U”) for (L–L”), (O–O”), (R–R”), (U–U”), in (V) for (M), (P), (S), in (W”) for (N–N”), (Q–Q”), (T–T”), (W–W”).

Heterogeneous endothelial requirements for Vegfs-dependent angiogenesis at the diencephalic choroid plexus (dCP)/pineal gland (PG) interface.

(A–H) Dorsal views of 10 days post fertilization (dpf) wild-type (WT) (A), vegfab-/- (B), vegfd-/- (C), vegfc-/- (D), vegfab-/-;vegfd-/- (E), vegfc-/-;vegfd-/- (F), vegfab-/-;vegfc-/- (G), and vegfab-/-;vegfc-/-;vegfd-/- (H) cranial vasculature visualized by Tg(kdrl:EGFP) expression. Yellow arrows point to the prosencephalic artery (PrA), blue arrows to the PG vessel (PGV), and orange arrows to the anterior cerebral vein (ACeV). A majority of vegfab-/-;vegfc-/- (G) and vegfab-/-;vegfc-/-;vegfd-/- (H) larvae lacked the PrA at either or both sides. vegfc-/-;vegfd-/- (F) and vegfab-/-;vegfc-/-;vegfd-/- (H), but not vegfab-/-;vegfc-/- (G), larvae displayed partially penetrant defects in PGV and/or ACeV formation. (I) Quantification of PrA, PGV, and ACeV formation at 10 dpf (the number of animals examined per genotype is listed in the panel). Statistical data support genetic interactions between vegfab and vegfc in PrA formation and between vegfd and vegfc in PGV and ACeV formation. No significant contributions of vegfd or vegfab to the formation of the PrA or PGV/ACeV, respectively, were noted. (J–Q) Dorsal views of 72 hours post fertilization (hpf) WT (J), vegfaa-/- (K), vegfab-/- (L), vegfc-/- (M), vegfab-/-;vegfaa-/- (N), vegfab-/-;vegfc-/- (O), vegfaa-/-;vegfc-/- (P), and vegfaa-/-;vegfab-/-;vegfc-/- (Q) cranial vasculature visualized by Tg(kdrl:EGFP) expression. Yellow arrows point to the PrA, blue arrows to the PGV, and orange arrows to the ACeV. vegfab-/-;vegfc-/-, but not their respective single mutants, exhibited pronounced PrA formation deficits. vegfaa-/- and vegfab-/-;vegfaa-/- displayed severe defects in mesencephalic vein (MsV) formation without a deficit in PrA, PGV, or ACeV development. vegfaa-/-;vegfc-/- and vegfaa-/-;vegfab-/-;vegfc-/- larvae exhibited a severe loss of the PrA and PGV. (R) Quantification of PrA, PGV, and ACeV formation at 72 hpf (the number of animals examined per genotype is listed in the panel). Statistical data support genetic interactions between vegfab and vegfc in PrA formation and between vegfaa and vegfc in PrA and PGV formation. Furthermore, significant genetic interactions among these three genes were detected in vascularization at this interface. In panels (I and R), each data point shown in magenta represents individual animal’s vessel formation score, and values represent means ± SD (*, **, ***, and **** indicate p<0.05, p<0.01, p<0.001, and p<0.0001, respectively, by one-way analysis of variance [ANOVA] followed by Tukey’s HSD test). Scale bars: 50 µm in (H) for (A–H) and in (Q) for (J–Q).

Endothelial cell-autonomous and cell non-autonomous requirements of Vegfc for vascularization of the diencephalic choroid plexus (dCP)/pineal gland (PG) interface.

(A–E) Dorsal views of 72 hours post fertilization (hpf) wild-type (WT) (A), vegfcum18/um18 (B), vegfab-/- (C), and vegfab-/-;vegfcum18/um18 (D, E) cranial vasculature visualized by Tg(kdrl:EGFP) expression. Yellow arrows point to the prosencephalic artery (PrA), blue arrows to the PG vessel (PGV), and orange arrows to the anterior cerebral vein (ACeV). Although none of vegfcum18/um18 and vegfab-/- fish exhibited a defect in PrA formation (B, C), approximately 21% of vegfab-/-;vegfcum18/um18 larvae lacked the PrA at either or both sides (E). (F) Quantification of PrA, PGV, and ACeV formation at 72 hpf (the number of animals examined per genotype is listed in the panel). Specific defect was observed in PrA formation in vegfab-/-;vegfcum18/um18 larvae compared to other three genotypes. (G, H) Dorsal views of 72 hpf vegfaa-/- (G) and vegfaa-/-;vegfcum18/um18 (H) cranial vasculature visualized by Tg(kdrl:EGFP) expression. Yellow arrows point to the PrA, blue arrows to the PGV, and orange arrows to the ACeV. Although vegfaa-/- or vegfcum18/um18 larvae fully formed vasculature at the dCP/PG interface, most of vegfaa-/-;vegfcum18/um18 larvae failed to form the PrA and PGV at either or both sides. (I) Quantification of PrA formation at 72 hpf (the number of animals examined per genotype is listed in the panel). The quantitative results of several genotypes were presented again or integrated in this graph for comparison purposes. Previously presented results are the vegfc-/- (hu6410 allele) data from Figure 4R, and the data in (F) were either re-presented or combined with the quantitative results shown in Figure 5G and H. Paracrine activity-deficient vegfcum18/um18 larvae in the vegfab-/- background displayed a significantly milder defect in PrA formation than that observed in vegfab-/-;vegfc-/- (hu6410 allele) animals that lack both endothelial cell-autonomous and cell non-autonomous Vegfc function. (J) Quantification of mesencephalic vein (MsV) formation at 72 hpf (the number of animals examined per genotype is listed in the panel). Severe defects in MsV formation in vegfaa-/- larvae were further exacerbated by genetic deletions of vegfc (um18 allele) or vegfab. (K) Schematic representations of the severe vascular phenotypes observed in 72 hpf various vegf mutants at the dCP/PG interface. Genetic results indicate highly heterogeneous molecular requirements for angiogenesis around the dCP/PG interface. In panels (F), (I), and (J), each data point shown in magenta represents individual animal’s vessel formation score, and values represent means ± SD (*, **, and **** indicate p<0.05, p<0.01, and p<0.0001, respectively, by one-way analysis of variance [ANOVA] followed by Tukey’s HSD test). Scale bars: 50 µm in (A) for (A–E) and in (G) for (G–H).

Co-localization of the pituicyte marker cyp26b1 and vegfaa or vegfab BAC transgenic reporter expression at early larval stages.

(A–A”) Single confocal z-plane images of 75 hours post fertilization (hpf) TgBAC(vegfaa:EGFP) ventral brain following in situ hybridization of cyp26b1, showing overlapping signals between the EGFP+ cells and cyp26b1+ pituicyte (n=10). Yellow arrowheads indicate the overlapping cells. (B–B”) Single confocal z-plane images of 75 hpf TgBAC(vegfab:EGFP) ventral brain following in situ hybridization of cyp26b1, showing overlapping signals between the EGFP+ cells and cyp26b1+ pituicyte (n=11). Yellow arrowheads indicate the overlapping cells.

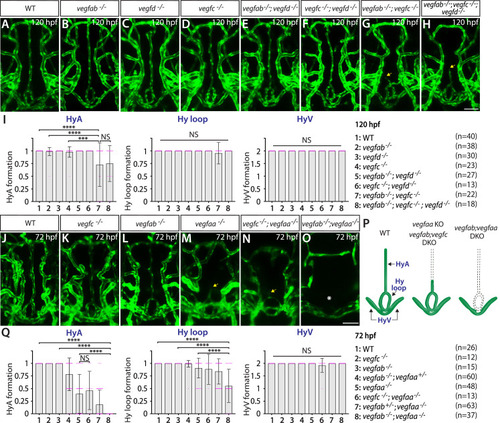
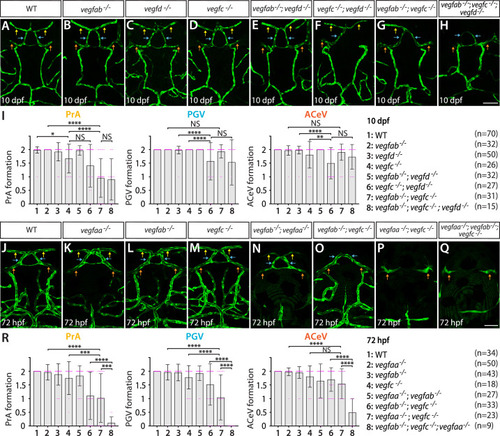
Heterogeneous endothelial requirements for Vegfs-dependent angiogenesis in the ventral brain around the neurohypophysis (NH)/organum vasculosum of the lamina terminalis (OVLT).

(A–H) Dorsal views of 120 hours post fertilization (hpf) wild-type (WT) (A), vegfab-/- (B), vegfd-/- (C), vegfc-/- (D), vegfab-/-;vegfd-/- (E), vegfc-/-;vegfd-/- (F), vegfab-/-;vegfc-/- (G), and vegfab-/-;vegfc-/-;vegfd-/- (H) ventral brain vasculature visualized by Tg(kdrl:EGFP) expression. A significant fraction of vegfab-/-;vegfc-/- (G) and vegfab-/-;vegfc-/-;vegfd-/- (H) larvae exhibited a partial formation of the hypophyseal artery (HyA), resulting in HyA stalling toward the palatocerebral arteries (PLA) (arrows, G, H). (I) Quantification of HyA, Hy loop, and hypophyseal vein (HyV) formation at 120 hpf (the number of animals examined per genotype is listed in the panel). vegfab-/-;vegfc-/- and vegfab-/-;vegfc-/-;vegfd-/- larvae displayed a specific and partially penetrant defect in HyA formation. (J–O) Dorsal views of 72 hpf WT (J), vegfc-/- (K), vegfab-/- (L), vegfaa-/- (M), vegfc-/-;vegfaa-/- (N), and vegfab-/-;vegfaa-/- (O) ventral brain vasculature visualized by Tg(kdrl:EGFP) expression. Similar to vegfab-/-;vegfc-/- larvae, vegfaa-/- fish exhibited a specific and partially penetrant defect in HyA formation, leading to HyA stalling toward the PLA (arrow, M). The severity of this phenotype was exacerbated by the simultaneous deletion of vegfab (O), but not of vegfc (arrow, N), showing a genetic interaction between vegfaa and vegfab, but not between vegfaa and vegfc. Intriguingly, phenotypes in vegfab-/-;vegfaa-/- larvae were restricted to the fenestrated HyA and Hy loop (asterisk, O) with no significant defect in HyV formation. (P) Schematic representations of the severe vascular phenotypes observed in 72 hpf various vegf mutants. (Q) Quantification of HyA, Hy loop, and HyV formation at 72 hpf. In panels (I and Q), each data point shown in magenta represents individual animal’s vessel formation score, and values represent means ± SD (*** and **** indicate p<0.001 and p<0.0001, respectively, by one-way analysis of variance [ANOVA] followed by Tukey’s HSD test). Scale bars: 50 µm in (H) for (A–H) and in (O) for (J–O).

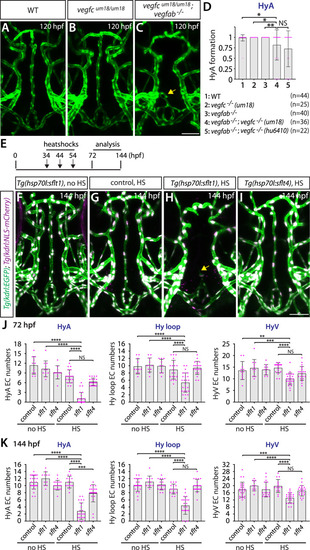
Temporal inhibition of Vegfa signaling by sFlt1 overexpression is sufficient to cause impaired formation of the hypophyseal artery (HyA) and Hy loop.

(A–C) Dorsal views of 72 hours post fertilization (hpf) wild-type (WT) (A), vegfcum18/um18 (B), and vegfcum18/um18;vegfab-/- (C) ventral brain vasculature visualized by Tg(kdrl:EGFP) expression. vegfcum18/um18;vegfab-/- larvae exhibited partial formation of the HyA, resulting in HyA stalling toward the palatocerebral arteries (PLA) (arrow, C). (D) Quantification of HyA formation at 120 hpf (the number of animals examined per genotype is listed in the panel). vegfcum18/um18;vegfab-/- larvae exhibited a significantly increased defect in HyA formation at a comparable level to that observed in vegfab-/-;vegfc-/- (hu6410 allele) animals. The HyA quantitative results of vegfab-/-;vegfc-/- (hu6410 allele) larvae from Figure 7I were integrated in this graph for comparison purposes. (E) Time course of the heatshock (HS) experiments for panels (F–I). (F–I) Dorsal views of ventral brain vasculature in 144 hpf Tg(hsp70l:sflt1) (F, H), Tg(hsp70l:sflt4) (I), and their control sibling (G) larvae that carried both the Tg(kdrl:EGFP) and Tg(kdrl:NLS-mCherry) transgenes after treatment with (G–I) and without (F) multiple HS. HS-induced overexpression of sFlt1 caused severe defects in HyA formation, leading to HyA stalling toward the PLA (arrow, H). (J, K) Quantification of the number of vascular endothelial cells (vECs) that comprise the HyA, Hy loop, and hypophyseal vein (HyV) at 72 (J) and 144 (K) hpf. HS-induced overexpression of sFlt1 led to a drastic reduction in the number of vECs that comprise the HyA and milder reduction of vEC numbers in Hy loop. In contrast, sFlt4 overexpression displayed no effect on the number of vECs that comprise the Hy loop and HyV, but caused a significant reduction in HyA vEC numbers at 144 hpf (K). The number of animals examined per treatment at 72 hpf: without HS treatment, n=11 for control, n=11 for sflt1, and n=10 for sflt4; with HS treatment, n=20 for control, n=25 for sflt1, and n=20 for sflt4. The number of animals examined at 144 hpf: without HS treatment, n=25 for control, n=11 for sflt1, and n=18 for sflt4; with HS treatment, n=15 for control, n=22 for sflt1, and n=21 for sflt4. In panels (D), (J), and (K), each data point shown in magenta represents individual animal’s quantification, and values represent means ± SD (*, **, ***, and **** indicate p<0.05, p<0.01, p<0.001, and p<0.0001, respectively, by one-way analysis of variance [ANOVA] followed by Tukey’s HSD test). Scale bar: 50 µm in (C) for (A–C) and in (I) for (F–I).

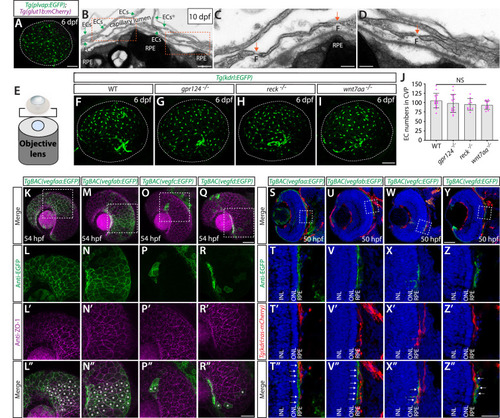
Normal choriocapillaris formation in zebrafish deficient for Wnt/β-catenin signaling, and conserved expression of Vegfa paralogs in retinal pigment epithelium (RPE).

(A) Dissected eye from 10 days post fertilization (dpf) Tg(plvap:EGFP);Tg(glut1b:mCherry) zebrafish immunostained for GFP and DsRed shows strong Tg(plvap:EGFP) and absent Tg(glut1b:mCherry) expression in the choriocapillaris (choroidal vascular plexus, CVP). (B–D) Transmission electron microscopy images of 10 dpf wild-type (WT) outer retina focused on the CVP and RPE layer. Magnified images of the boxed areas in (B) show the presence of fenestrae (F) in the vascular endothelial cells (vECs) comprising the CVP (orange arrows, C, D). (E) Schematic diagram of 3D confocal CVP imaging from the back of dissected eyes. (F–I) WT (F), gpr124-/- (G), reck-/- (H), and wnt7aa-/- (I) CVP visualized by Tg(kdrl:EGFP) expression at 6 dpf. Confocal z-stack images of dissected eyes were taken after immunostaining for GFP. (J) Quantification of vECs that comprise the CVP at 6 dpf (n=15 for WT, n=16 for gpr124-/-, n=10 for reck-/-, and n=11 for wnt7aa-/- fish). No significant difference was observed across these genotypes. Each data point shown in magenta represents individual animal’s quantification. Refer to Figure 9—source data 1 for the precise cell counts of individual larvae. (K–R”) Lateral views of 54 hours post fertilization (hpf) TgBAC(vegfaa:EGFP) (K), TgBAC(vegfab:EGFP) (M), TgBAC(vegfc:EGFP) (O), and TgBAC(vegfd:EGFP) (Q) embryos immunostained for GFP and ZO-1, a tight junction marker for RPE. Magnified images of the boxed areas in (K), (M), (O), and (Q) are shown in (L–L”), (N–N”), (P–P”), and (R–R”), respectively. TgBAC(vegfaa:EGFP) and TgBAC(vegfab:EGFP) expression was broadly co-localized with ZO-1 immunoreactivity in RPE (asterisks in L”, N”). Sparse EGFP+ cells were observed in TgBAC(vegfc:EGFP) and TgBAC(vegfd:EGFP) eyes, some of which were co-localized with ZO-1 immunoreactivity (asterisks in P”, R”). (S–Z”) Cryosections of 50 hpf TgBAC(vegfaa:EGFP) (S), TgBAC(vegfab:EGFP) (U), TgBAC(vegfc:EGFP) (W), and TgBAC(vegfd:EGFP) (Y) embryos that carried the Tg(kdrl:ras-mCherry) transgene. Sections were immunostained for GFP and DsRed, and counterstained for DAPI. Magnified images of the boxed areas in (S), (U), (W), and (Y) are shown in (T–T”), (V–V”), (X–X”), and (Z–Z”), respectively. TgBAC(vegfaa:EGFP) and TgBAC(vegfab:EGFP) expression was broadly observed in the RPE layer directly adjacent to the CVP (white arrows in T”, V”). Sparse EGFP+ cells on TgBAC(vegfc:EGFP) and TgBAC(vegfd:EGFP) sections resided in close proximity to the CVP (white arrows in X”, Z”). NL: inner nuclear layer, ONL: outer nuclear layer. Scale bars: 500 nm in (B); 200 nm in (C), (D); 50 µm in (A), in (I) for (F–I), in (Q) for (K), (M), (O), in (Y) for (S), (U), (W); 30 µm in (R”) for (L–L”), (N–N”), (P–P”), (R–R”); 25 µm in (Z”) for (T–T”), (V–V”), (X–X”), (Z–Z”).

Quantification of the number of endothelial cells that comprised the choroidal vascular plexus (CVP) in wild-type (WT), <italic toggle='yes'>gpr124<sup>-/-</sup></italic>, <italic toggle='yes'>reck<sup>-/-</sup></italic>, and <italic toggle='yes'>wnt7aa<sup>-/-</sup></italic> at 6 days post fertilization (dpf).

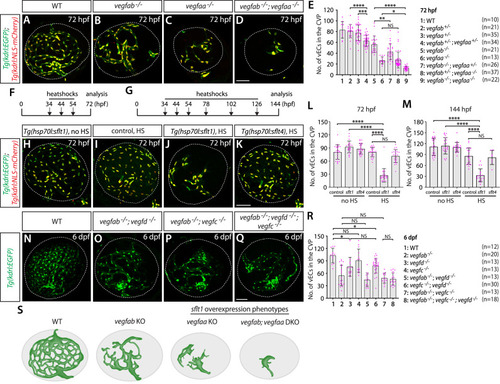
Zebrafish Vegfa paralogs are redundantly required for fenestrated choroidal vascular plexus (CVP) formation.

(A–D) Wild-type (WT) (A), vegfab-/- (B), vegfaa-/- (C), and vegfab-/-;vegfaa-/- (D) CVP visualized by Tg(kdrl:EGFP) and Tg(kdrl:NLS-mCherry) expression at 72 hours post fertilization (hpf). (E) Quantification of the number of vascular endothelial cells (vECs) that comprise the CVP at 72 hpf (the number of animals examined per genotype is listed in the panel). Zebrafish vegfa paralogs genetically interacted in fenestrated CVP formation. (F, G) Time course of the heatshock (HS) experiments for panels (H–M). (H–K) The CVP of 72 hpf Tg(hsp70l:sflt1) (H, J), Tg(hsp70l:sflt4) (K), and their control sibling (I) larvae that carried both the Tg(kdrl:EGFP) and Tg(kdrl:NLS-mCherry) transgenes after treatment with (I–K) and without (H) multiple HS. HS-induced overexpression of sFlt1 led to pronounced reductions in the number of vECs constituting the CVP (J). (L, M) Quantification of the number of vECs that comprise the CVP at 72 (L) and 144 (M) hpf with and without HS treatments. The number of animals examined per treatment at 72 hpf: without HS treatment, n=23 for control, n=21 for sflt1, and n=25 for sflt4; with HS treatment, n=23 for control, n=24 for sflt1, and n=23 for sflt4. The number of animals examined at 144 hpf: without HS treatment, n=22 for control, n=21 for sflt1, and n=20 for sflt4; with HS treatment, n=20 for control, n=28 for sflt1, and n=24 for sflt4. (N–Q) WT (N), vegfab-/-;vegfd-/- (O), vegfab-/-;vegfc-/- (P), and vegfab-/-;vegfd-/-;vegfc-/- (Q) CVP visualized by Tg(kdrl:EGFP) expression at 6 days post fertilization (dpf). (R) Quantification of the number of vECs that comprise the CVP at 6 dpf (the number of animals examined per genotype is listed in the panel). Refer to Figure 10—source data 1 for the precise cell counts of individual larvae. (S) Schematic representations of the CVP phenotypes observed in vegfa mutants and after sFlt1 overexpression at 72 hpf. Temporal inhibition of Vegfa signaling by sFlt1 overexpression recapitulated the severely impaired CVP phenotypes observed in genetic mutants. In panels (E), (L), (M), and (R), each data point shown in magenta represents individual animal’s quantification, and values represent means ± SD (*, **, ***, and **** indicate p<0.05, p<0.01, p<0.001, and p<0.0001, respectively, by one-way analysis of variance [ANOVA] followed by Tukey’s HSD test). Scale bars: 50 µm in (D) for (A–D), in (K) for (H–K), in (Q) for (N–Q).

Quantification of the number of endothelial cells that comprised the choroidal vascular plexus (CVP) in wild-type (WT) and various <italic toggle='yes'>vegf</italic> mutants at 6 days post fertilization (dpf).

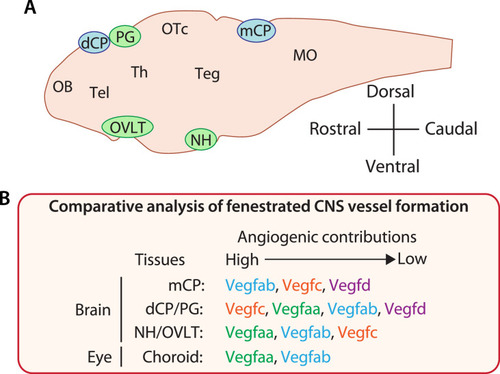
Comparative analysis of vascularization across fenestrated central nervous system (CNS) vascular beds reveals crucial angiogenic interplay of Vegfc/d and Vegfa in choroid plexus (CP) and circumventricular organ (CVO) vascularization.

(A) Schematic diagram of a mid-sagittal section of the larval zebrafish brain indicates the location of the CPs and CVOs examined in our current and previous studies. MO: medulla oblongata, OB: olfactory bulb, OTc: optic tectum, Teg: tegmentum, Tel: telencephalon, Th: thalamus. (B) Summary of findings from our comparative analysis of fenestrated vessel formation. Angiogenic contributions were speculated based on the severity and penetrance of observed phenotypes and also on the levels of genetic interactions detected to cause phenotypes. This comparative result reveals CNS region-specific requirements for Vegfs-dependent angiogenesis and identifies an unexpected role for Vegfc/d in fenestrated brain vessel formation.

Acknowledgments
This image is the copyrighted work of the attributed author or publisher, and ZFIN has permission only to display this image to its users. Additional permissions should be obtained from the applicable author or publisher of the image. Full text @ Elife