
Fig. 1
- ID
- ZDB-FIG-230519-35
- Publication
- He et al., 2022 - Translational control by maternal Nanog promotes oogenesis and early embryonic development
- Other Figures
- All Figure Page
- Back to All Figure Page
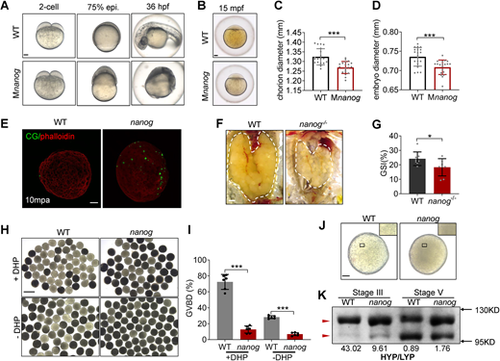
Loss of maternal nanog results in oocyte maturation defects. (A) Bright-field images showing the embryonic malformation of Mnanog mutants in contrast to time-matched WT embryos. Scale bar: 100 μm. (B) WT and Mnanog embryos with chorions at 15 mpf. Scale bar: 100 μm. (C,D) Measurement of chorion diameter and oocyte diameter at 15 mpf. ***P<0.001. n=20. (E) Representative images showing labeling of CGs in WT and nanog mutant eggs fixed at 10 mpa. F-actin was stained using phalloidin to show the outline of embryo. Scale bar: 100 μm. n=25. (F) Appearance of ovaries (outlined) dissected from WT and nanog−/− females. Scale bar: 1 mm. (G) The GSI of WT and nanog−/− females. n=8. *P<0.05. (H) Morphology of stage IV follicles dissected from WT and nanog−/− ovaries with or without incubation in DHP (1 μg/ml) for 2 h. Scale bar: 1 mm. (I) Comparison of the GVBD percentage in WT and nanog mutant follicles. Six fish of each group were analyzed. (J) Stage V follicles from WT and nanog mutant. Insets show enlarged regions of the yolk and relative opaqueness is seen in nanog mutants. Scale bar: 100 μm. (K) SDS-PAGE and Coomassie staining of major yolk proteins of stage III and stage V follicles. The higher and lower molecular weight yolk proteins (HYP and LYP) are indicated by the red arrowheads. HYP/LYP ratios were calculated (shown underneath) to represent yolk protein cleavage levels. |