
- Title
-
Translational control by maternal Nanog promotes oogenesis and early embryonic development
- Authors
- He, M., Jiao, S., Zhang, R., Ye, D., Wang, H., Sun, Y.
- Source
- Full text @ Development
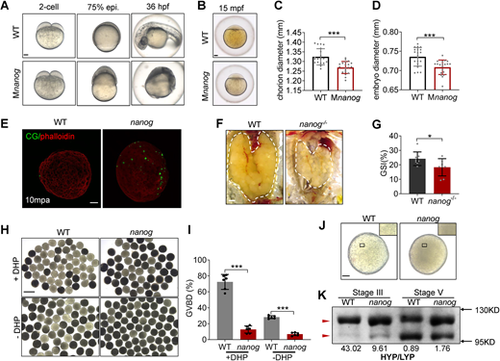
Loss of maternal nanog results in oocyte maturation defects. (A) Bright-field images showing the embryonic malformation of Mnanog mutants in contrast to time-matched WT embryos. Scale bar: 100 μm. (B) WT and Mnanog embryos with chorions at 15 mpf. Scale bar: 100 μm. (C,D) Measurement of chorion diameter and oocyte diameter at 15 mpf. ***P<0.001. n=20. (E) Representative images showing labeling of CGs in WT and nanog mutant eggs fixed at 10 mpa. F-actin was stained using phalloidin to show the outline of embryo. Scale bar: 100 μm. n=25. (F) Appearance of ovaries (outlined) dissected from WT and nanog−/− females. Scale bar: 1 mm. (G) The GSI of WT and nanog−/− females. n=8. *P<0.05. (H) Morphology of stage IV follicles dissected from WT and nanog−/− ovaries with or without incubation in DHP (1 μg/ml) for 2 h. Scale bar: 1 mm. (I) Comparison of the GVBD percentage in WT and nanog mutant follicles. Six fish of each group were analyzed. (J) Stage V follicles from WT and nanog mutant. Insets show enlarged regions of the yolk and relative opaqueness is seen in nanog mutants. Scale bar: 100 μm. (K) SDS-PAGE and Coomassie staining of major yolk proteins of stage III and stage V follicles. The higher and lower molecular weight yolk proteins (HYP and LYP) are indicated by the red arrowheads. HYP/LYP ratios were calculated (shown underneath) to represent yolk protein cleavage levels. |

Loss of nanog triggers ER stress and UPR and elevates global translation activity. (A) Fluorescent images showing mCherry reporter levels with GFP protein control levels in WT and Mnanog embryos at 4 hpf. Scale bar: 100 μm. (B) Measurement of mCherry reporter intensities relative to GFP. **P<0.01. n=14. (C,D) Western blotting analysis of mCherry reporter levels at 4 hpf. *P<0.05. (E) Western blot analysis of Hspa5 and Ddit3 in WT and nanog−/− ovaries. (F-I) RT-qPCR analysis of hsp5a (F), ddit3 (G), atf6 (H) and ire1a (I) in WT and nanog−/− ovaries. **P<0.01, ***P<0.001. n=4. (J) Western blot analysis of S6 and phosphorylated S6 in WT and nanog−/− ovaries. The internal control of GAPDH is shown in E. (K) Statistical analysis of phosphorylated S6/S6 ratio shown in J. ***P<0.001. (L) Morphology of stage IV follicles dissected from WT and nanog−/− ovaries and treated with two different PERK inhibitors for 2 h. Follicles dissected from three fish were treated with inhibitors for 2 h (all in the presence of DHP). Final concentrations: GSK2606414, 50 nM; ISRIB, 5 μM; DHP, 1 μg/ml. Scale bar: 1 mm. (M) Comparison of GVBD percentage in WT and nanog mutant follicles treated with or without PERK inhibitor. n=3. *P<0.05, **P<0.01, ***P<0.001. |
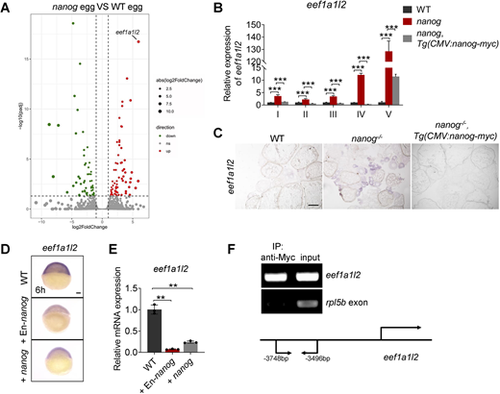
Nanog transcriptionally inhibits the expression of eef1a1l2. (A) RNA-seq analysis showing significantly increased expression of eef1a1l2 in nanog null eggs. Red dots indicate upregulated genes, green dots indicate downregulated genes, and gray dots indicate genes that were not differentially expressed in nanog mutant eggs. (B) Detection of eef1a1l2 expression in nanog mutant oocytes at different stages revealed by RT-qPCR. ***P<0.001. n=3. (C) Detection of eef1a1l2 expression in ovaries of WT, nanog mutant, and Tg(CMV:nanog-myc) in nanog mutant background by in situ hybridization on cryosections. Scale bar: 200 μm. (D,E) WISH (D) and RT-qPCR (E) analysis showed reduced expression of eef1a1l2 in nanog or En-nanog overexpressed embryos at 6 hpf. Images in D are representative of 36/36 embryos for WT, 38/39 for +EN-nanog and 32/32 for +nanog. **P<0.01. n=3. Scale bar: 100 μm. (F) ChIP analysis of Tg(CMV:nanog-myc) ovaries with anti-Myc antibody at 6 months post-fertilization. The promoter region of eef1a1l2 was enriched in precipitated chromatin. rpl5b served as a negative control. Schematic depicts the genomic sequence of eef1a1l2, and the sequence located between −3748 and −3496 bp upstream of the amplified region. |

Depletion of eef1a1l2 rescues impaired oocyte maturation of the nanog mutant. (A) WT, Meef1a1l2, Mnanog and Mnanog,Meef1a1l2 embryos with chorions at 15 mpf. Scale bar: 100 μm. (B,C) Measurement of chorion diameters and oocyte diameters at 15 mpf. *P<0.05, ***P<0.001. NS, no significant difference. n=20. (D) Representative images showing labeling of CGs in WT, nanog and nanog,eef1a1l2 double-mutant eggs fixed at 10 mpa. F-actin was stained using phalloidin to show the outline of the embryo. n=15. Scale bar: 100 μm. (E) Appearance of ovaries (outlined) dissected from WT, eef1a1l2−/−, nanog−/− and nanog−/−,eef1a1l2−/− females. Scale bar: 1 mm. (F) GSI of WT, eef1a1l2−/−, nanog−/− and nanog−/−,eef1a1l2−/− females. n=3. *P<0.05, ***P<0.001. NS, no significant difference. (G) Morphology of stage V follicles from WT, eef1a1l2−/−, nanog−/− and nanog−/−,eef1a1l2−/−. Insets show enlarged regions of the yolk. Scale bar: 100 μm. (H) SDS-PAGE and Coomassie staining of major yolk proteins of stage III and stage V follicles. The higher and lower molecular weight yolk proteins (HYP and LYP) are indicated by red arrows. HYP/LYP ratios (shown above) were calculated to represent yolk protein cleavage levels. (I) Morphology of stage IV follicles dissected from WT, eef1a1l2−/−, nanog−/− and nanog−/−,eef1a1l2−/− ovaries with or without DHP (1 μg/ml) incubation for 2 h. Scale bar: 1 mm. (J) Comparison of the GVBD percentage in WT, eef1a1l2−/−, nanog−/− and nanog−/−,eef1a1l2−/− follicles. **P<0.01, ***P<0.001. NS, no significant difference. n=4. |
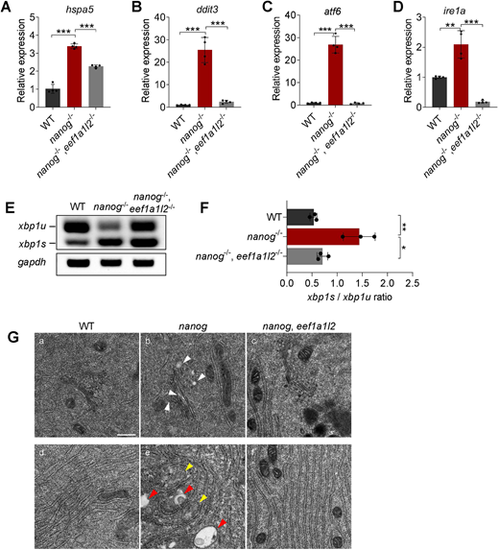
Depletion of eef1a1l2 ameliorates ER stress and UPR in nanog mutant oocytes. (A-D) RT-qPCR analysis showing decreased expression of hspa5 (A), ddit3 (B), atf6 (C) and ire1a (D) in nanog and eef1a1l2 double-mutant ovaries, compared with nanog mutant ovaries. **P<0.01, ***P<0.001. n=4. (E,F) RT-PCR examination of xbp1 splicing. The ratio of spliced xbp1 (xbp1s) mRNA to unspliced xbp1 (xbp1u) mRNA was increased in nanog mutant ovaries, but restored in nanog and eef1a1l2 double-mutant ovaries. gapdh was used as internal control. The xbp1s/xbp1u ratio in F represents the intensity ratio of the corresponding PCR product bands in E. *P<0.05, **P<0.01. n=3. (G) ER, Golgi and mitochondria structure in WT, nanog mutant and double-mutant stage I oocytes as revealed by transmission electron microscopy. White arrowheads indicate Golgi apparatus, yellow arrowheads indicate mitochondria, red arrowheads indicate lysosomes. Scale bar: 0.5 μm. |
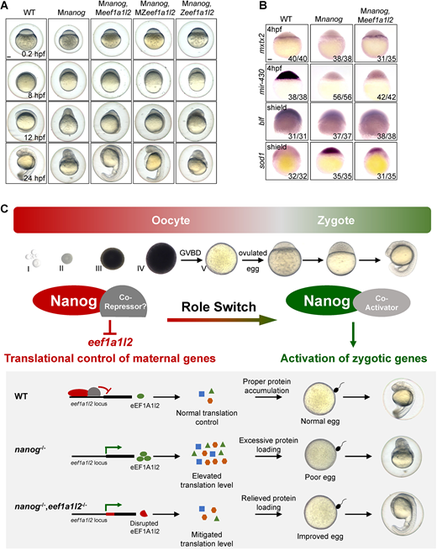
Maternal depletion of eef1a1l2 rescues the early embryonic defects of the nanog mutant. (A) Phenotype of WT, Mnanog, Mnanog,Meef1a1l2, Mnanog,MZeef1a1l2 and Mnanog,Zeef1a1l2 embryos at 0.2, 8, 12 and 24 hpf. Scale bar: 100 μm. (B) Detection of mxtx2, mir-430 precursor, blf and sod1 in WT, Mnanog and Mnanog,Meef1a1l2 embryos by WISH at the indicated stages. Scale bar: 100 μm. (C) Proposed model of Nanog function in oogenesis and early embryogenesis of zebrafish. Top: Nanog acts as a transcriptional repressor to suppress the expression of eef1a1l2 and maintain the correct translation level of maternal mRNAs during oocyte development. Then, Nanog switches to a transcriptional activator to prime ZGA in zygotes. Bottom: In WT oocytes, Nanog inhibits the transcription of eef1a1l2 and maintains the proper level of global translation, ensuring appropriate amounts of proteins are expressed. Good egg quality and normal embryonic development is thus guaranteed. In the absence of maternal nanog (nanog−/−), the balance of global translation is destroyed. Elevated translation results in excessive protein loading, leading to poor egg quality and failure of embryogenesis. In nanog and eef1a1l2 double-mutant oocytes (nanog−/−,eef1a1l2−/−), the global translation level is mitigated owing to the absence of eEF1A1l2, protein overloading is relieved and egg quality is also improved, thereby promoting a better embryonic morphology formation. Representative images shown in the schematic include data also shown in Figs 4G and 6A. |