
Figure 5.
- ID
- ZDB-FIG-230131-9
- Publication
- Brewer et al., 2022 - Macrophage NFATC2 mediates angiogenic signaling during mycobacterial infection
- Other Figures
- All Figure Page
- Back to All Figure Page
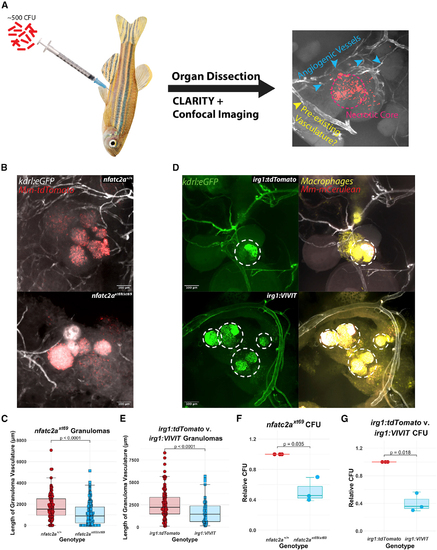
Angiogenesis in epithelioid granulomas depends on macrophage-NFAT signaling and nfatc2a (A) Schematic of adult infections. Adult zebrafish are infected with ∼500 CFU of fluorescent mycobacteria (Mm-mCerulean for irg1:VIVIT-tdTomato and irg1:tdTomato, Mm-tdTomato for nfatc2a) and after granulomas have established (≥14 dpi), peritoneal organs are harvested, fixed, and cleared of birefringent lipids. After confocal imaging and Z projection, various types of vasculature can be observed, including abnormal-appearing spindles and webs of vascular sprouts as well as more-established luminal vessels that potentially comprised the existing vascular network at that location. Dashed circle delineates necrotic core; blue arrowheads neovascularization; yellow arrowheads indicate thicker vasculature, which presumably was pre-existing. (B) Representative images of kdrl:eGFP; nfatc2axt69/xt69 and kdrl:eGFP; nfatc2a+/+ siblings. The extensive vascular network observed in wild-type animals is reduced in the nfatc2axt69/xt69 animals. Note that the vessels emerge in all three dimensions around and occasionally into the outer layers of the granuloma. (C) Quantitation of the total proximal vessel length in kdrl:eGFP; nfatc2axt69/xt69 and kdrl:eGFP; nfatc2a+/+ siblings 18 days after infection with 500 CFU. Each data point represents a single granuloma; n = 121 wild-type granulomas, 151 homozygous mutant granulomas over 6 separate animals per genotype. Representative of 3 independent experiments. Quantitation was performed under programmatic blinding. nfatc2axt69/xt69 fish display ∼40%–70% reduction in average sum vascular network length compared with wild-type siblings (see also Figures S3A and S3B). Statistics from Student’s t test. (D) Representative images of irg1:VIVIT-tdTomato; kdrl:eGFP and irg1:tdTomato; kdrl:eGFP granulomas. Dashed circles highlight the necrotic cores, which, due to both autofluorescence and leaky emission capture from the Mm-mCerulean bacteria, bleed into the GFP channel. irg1:tdTomato fish display robust interpenetration of blood vessels into and around the granuloma while little angiogenesis is seen in the irg1:VIVIT-tdTomato condition (see also Figure S3C). Note the large, luminal vessel in the irg1:VIVIT-tdTomato granuloma, which appears mature and may have existed preceding infection, but is included in quantitation. (E) Quantitation of the total vessel length in irg1:VIVIT-tdTomato; kdrl:eGFP and irg1:tdTomato; kdrl:eGFP granulomas. Each data point represents a single granuloma; n = 84 tdTomato, 74 VIVIT granulomas over 6 independent animals per genotype. Representative of three independent experiments. Quantitation was performed under programmatic blinding. irg1:VIVIT-tdTomato fish display a 30%–60% reduction in total vessel length compared with irg1:tdTomato (see also Figures S3D and S3E). Statistics are from Student’s t test. (F) Enumeration of bacterial burden from whole infected adult zebrafish 24 dpi. nfatc2axt69/xt69 and nfatc2a+/+ siblings were infected with 1,000 CFU Mm-tdTomato. The experiment was performed independently three times and each data point represents the median CFU from up to eight fish within a single experiment normalized to the wild-type siblings for that replicate. nfatc2axt69/xt69 fish had a ∼55% median reduction in CFU compared with wild type. Statistics from Student’s t test comparing median CFU values from each of three independent experiments, each with eight fish per genotype. (G) Enumeration of bacterial burden in whole infected adult zebrafish 18 dpi. irg1:VIVIT-tdTomato and irg1:tdTomato fish were infected with 1,000 CFU Mm-tdTomato. Each data point is the median CFU value from an independent experiment and each experiment contains up to eight fish of each genotype. irg1:VIVIT-tdTomato fish had a ∼65% median reduction in CFU compared with control fish. Statistics from Student’s t test comparing median CFU values from each of three independent experiments, each with eight fish per genotype. |