
Figure 7.
- ID
- ZDB-FIG-230131-11
- Publication
- Brewer et al., 2022 - Macrophage NFATC2 mediates angiogenic signaling during mycobacterial infection
- Other Figures
- All Figure Page
- Back to All Figure Page
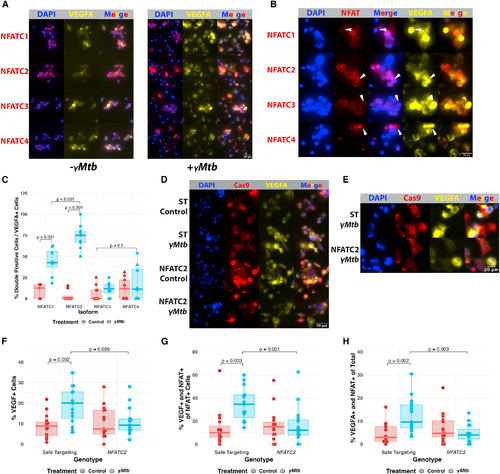
NFATC2 is required for the VEGFA response of cultured macrophages to γMtb exposure (A) Immunofluorescence staining of THP-1 macrophages in the presence or absence of γMtb to identify potential NFAT isoforms of interest in human cells. NFATC2 is most robustly expressed and inducibly nuclear of these isoforms in macrophages. NFATC1 and NFATC3 are comparatively less expressed and less extensively translocated by 8 h post exposure. NFATC4 is very lowly expressed initially but, like all the isoforms, appears to be upregulated at the protein level after γMtb exposure. Initial staining from a single experiment, with NFATC2 validation from three biological replicates in (D–G). (B) Magnified images showing robust VEGFA expression in cells with nuclear NFATC2 compared with cells with nuclear NFATC1, NFATC3, and NFATC4, which lack the strong correspondence between NFAT nuclear localization and VEGFA induction, which is only seen with NFATC2 staining. (C) Blinded quantitation of the relationship between each NFAT isoform and the induction of VEGFA. We calculated the subset of cells expressing both VEGFA and demonstrating obvious NFAT nuclear localization and normalized to the total number of cells expressing VEGFA in that field. Initial staining from a single experiment, with validation in (D–G). Total number of cells counted = 5,859. Statistics from ANOVA with Tukey honest significant differences test. (D) THP-1 cells transduced with Cas9-expressing lentiviruses targeting either NFATC2 (Figures S4F and S4G) or safe-targeting loci (Figure S4H) were selected with puromycin and then treated with γMtb or vehicle. Safe-targeting-transduced THP-1 cells robustly responded to γMtb with VEGFA production at 8 h post exposure, but fewer NFATC2-transduced cells produce VEGFA after stimulation and at lower staining intensity. Representative of three biological replicates. (E) Magnified images showing high VEGFA induction in γMtb-treated NFATC2-targeted THP-1 cells compared with γMtb-treated safe targeting (ST) THP-1 cells. The ST cells show robust VEGFA induction and NFAT nuclear translocation while NFATC2 cells show diminished VEGFA induction and disordered nuclear translocation and occasional lack of NFATC2 staining entirely; the antibody used to detect NFATC2 is N-terminal to the sgRNA sites, so residual expression is likely captured by the antibody. Representative of three biological replicates. (F) Blinded quantitation of the percentage of VEGFA+ cells within entire images for (D and E). Each data point represents the percentage of VEGFA+ cells in the field; 15 total fields were counted for each groups (5 from each of 3 independent experiments). Total number of cells counted = 5,029. Statistics from ANOVA with Tukey honest significant differences test. (G) Blinded quantitation of the percentage of VEGFA+ and nuclear-localized NFAT out of the total number of cells with NFAT nuclear localization within entire images for (D) and (E). Fifteen total fields were counted for each groups (5 from each of 3 independent experiments). Total number of cells counted = 5,029. Statistics from ANOVA with Tukey honest significant differences test. (H) Blinded quantitation of the percentage of VEGFA+ and nuclear-localized NFAT of the total number of cells in the images for (D) and (E). Fifteen total fields were counted for each group (5 from each of 3 independent experiments). Total number of cells counted = 5,029. Statistics from ANOVA with Tukey honest significant differences test. |