
- Title
-
Macrophage NFATC2 mediates angiogenic signaling during mycobacterial infection
- Authors
- Brewer, W.J., Xet-Mull, A.M., Yu, A., Sweeney, M.I., Walton, E.M., Tobin, D.M.
- Source
- Full text @ Cell Rep.
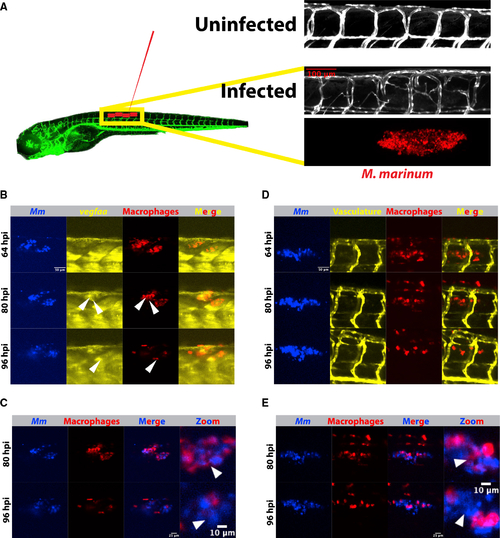
(A) Schematic depicting Tg(kdrl:eGFPs843) zebrafish and the approximate injection site, where ∼50–150 fluorescent Mycobacterium marinum are injected. Inset above displays a confocal image from the trunk region of a kdrl:eGFP zebrafish larva and the highly stereotyped intersomitic vascular patterning. Below, an image from an infected 4 days post infection (dpi) larval zebrafish showing the aberrant vasculature that develops over the course of infection and is the subject of the later quantitation. Also shown is the bacterial channel, demonstrating that this angiogenesis occurs at the site of infection. (B) Time lapse of larval Tg(irg1:tdTomatoxt40); TgBAC(vegfaa:eGFPpd260) zebrafish infected with 50–150 Mm-eBFP2 (blue) showing an increase in vegfaa reporter (yellow) levels in macrophages (red) over 96 h of imaging. Arrowheads indicate macrophages positive for vegfaa:egfp expression. Scale bar, 50 μm. Representative of 32 fish from one experimental replicate. Stills from Video S1. (C) Overlay of macrophage and bacterial fluorescence channels from (B) shows a general increase in the extracellular bacterial growth beginning approximately 80 h post infection, correlating with the increasing vegfaa signal in (B). Scale bars, 25 μm and 10 μm (in cropped images). Arrowheads indicate examples of intracellular bacteria at 80 hpi and then extracellular bacteria at the same approximate location at 96 hpi. (D) Time-lapse imaging of zebrafish vasculature and macrophages using the transgenic line irg1:tdTomato; kdrl:eGFP. Angiogenesis accelerates as extracellular bacteria accumulate, but at a relative delay from induction of the vegfaa:eGFP reporter (64–80 hpi versus 80–96 hpi), suggesting that vegfaa transcription precedes the angiogenic response. Representative of 32 fish from one experimental replicate. Scale bar, 50 μm. Stills from Video S2. (E) Overlay of the macrophage and bacterial fluorescence channels showing increasing extracellular growth, with the highest degree of angiogenesis at time points with the largest number of extracellular bacteria (D). Scale bars, 25 μm and 10 μm (in cropped images). |
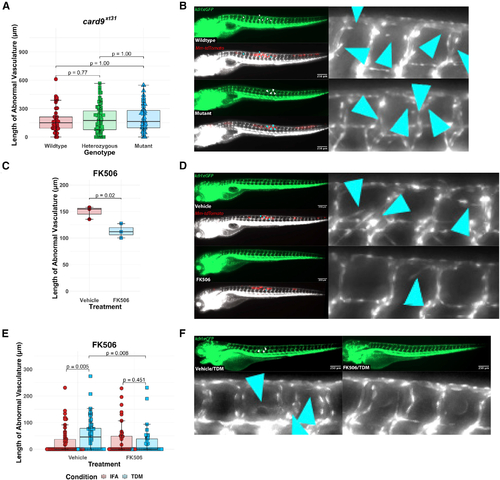
Pharmacological blockade of NFAT signaling inhibits angiogenesis while genetic ablation of card9 does not (A) Quantitation of angiogenic vessels along the trunk of card9 mutant, heterozygous, and wild-type animals 4 days post infection (dpi) with Mm-tdTomato. Each data point represents a single larva, n = 44 wild-type, 89 heterozygotes, 45 homozygous mutants. No statistically significant differences observed across the groups by Dunn’s Kruskal-Wallis multiple comparisons test with Holm error correction. Representative of three independent experiments. Additional independent replicates provided in Figures S1B and S1C. (B) Representative images from card9 wild-type and homozygous mutant zebrafish. Note the emergence of non-stereotypical vessels into the somites near the site of infection (inset). Arrowheads indicate regions of neovascularization. Scale bar, 250 μm. (C) Quantitation of angiogenesis along the trunk of Mm-tdTomato-infected wild-type kdrl:eGFP zebrafish treated with either 125 nM FK506 or 0.0125% DMSO (vehicle) diluted in E3 medium. Each point represents mean vessel length within an independent biological replicate of 60–96 animals, with equal numbers of animals per replicate across three replicates. Box-and-whisker plot shows interquartile ranges. Statistical significance determined by Student’s t test. (D) Representative images of FK506- or vehicle-treated larvae. A single dose at a concentration that showed no developmental toxicity was provided immediately after infection. Doses at or above ∼500 nM proved developmentally toxic. Arrowheads indicate ectopic vessels at the site of infection. (E) Quantitation of angiogenesis from wild-type kdrl:eGFP larval zebrafish injected with 2 mg/mL TDM in ∼10–20 nL bolus or comparable volume of IFA vehicle alone. Treatment with 125 nM FK506 or 0.0125% ethanol (vehicle) for 2 dpi. Points shown are a random subset of 200 fish (50 fish per group) out of a total of 524 represented larvae to minimize data crowding. Each point represents a single larva with data pooled from three independent experiments. Statistics from Dunn’s Kruskal-Wallis multiple comparisons test with Holm error correction on the whole dataset. (F) Representative images from FK506-treated or ethanol (vehicle)-treated larvae at 2 dpi of TDM-injected larvae. FK506-treated larvae demonstrate a reduction in the degree of angiogenesis compared with the ethanol-treated group. Arrowheads indicate regions of angiogenesis. |
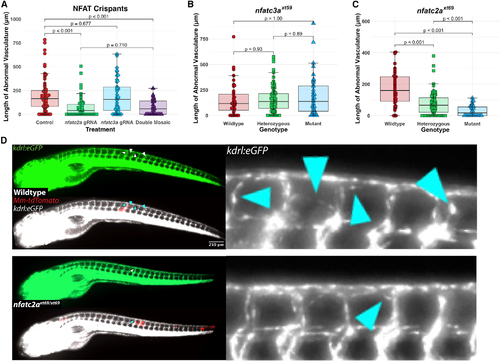
nfatc2a, but not nfatc3a, is required for the angiogenic response to mycobacterial infection in vivo (A) Quantitation of ectopic vasculature from sgRNP-injected, Mm-infected kdrl:eGFP larval zebrafish. A single high-scoring sgRNA was selected from CRISPRscan and injected either singly (nfatc2a gRNA, nfatc3a gRNA) or at an identical total RNA mass (double mosaic). At 2 dpf, these were infected along the trunk with Mm-tdTomato and imaged at 4 days post infection (dpi). Each point represents a single larva. Control fish are uninjected siblings. n = 63 control, 55 nfatc2a, 42 nfatc3a, 31 double mosaic. Statistics are from Dunn’s Kruskal-Wallis multiple comparisons test with Benjamini-Hochberg adjustment for independent tests. Representative of three biological replicates. Additional replicates provided in Figures S2A and S2B. (B) Blinded quantitation of angiogenic vessels from larvae from a heterozygous incross of kdrl:eGFP; nfatc3axt59/+ fish demonstrated no differences across the genotypes, confirming preliminary findings in (A). Data from a single experiment, n = 39 wild-type, 89 heterozygous, 39 homozygous mutant. Statistics by Dunn’s Kruskal-Wallis multiple comparisons test with Benjamini-Hochberg adjustment. (C) Quantitation of angiogenesis from a heterozygous incross of kdrl:eGFP; nfatc2axt69/+ fish under genotypic blinding. Homozygous mutant fish display an average of ∼30%–90% reduction in the length of angiogenic vessels. Representative of three independent experiments (additional replicates in Figures S2E and S2F). Statistics by Dunn’s Kruskal-Wallis multiple comparisons test with Benjamini-Hochberg adjustment. n = 44 wild-type, 92 heterozygous, 35 homozygous mutant. (D) Representative images from kdrl:eGFP; nfatc2axt69/xt69 and kdrl:eGFP; nfatc2a+/+ larvae. Vascularization in the homozygous mutant is notably reduced compared with wild type. Arrowheads indicate areas of neovascularization. |
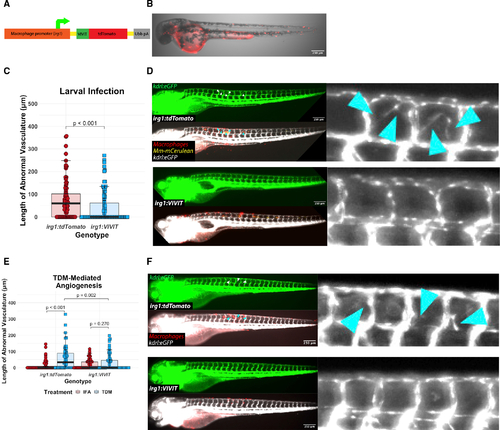
Macrophage-specific inhibition of NFAT signaling reduces angiogenesis in vivo during mycobacterial infection and in response to purified TDM (A) Diagram of the Tg(irg1:VIVIT-tdTomatoxt39) line. The VIVIT peptide is directly conjugated to the tdTomato fluorescent protein and expression is driven by a −4.6 kb macrophage-specific irg1 promoter. (B) Representative 2 day post fertilization larva showing macrophage-specific tdTomato+ expression throughout the larva. Note background expression in the yolk. Scale bar, 250 μm. (C) Quantitation of angiogenesis during Mm infection of irg1:VIVIT-tdTomato or irg1:tdTomato larvae. irg1:VIVIT larvae display a statistically significant reduction in the degree of angiogenesis induced by infection at 4 dpi compared with irg1:tdTomato larvae. Statistics from Wilcoxon ranked-sign test. Representative of three independent biological replicates. Additional replicates are shown in Figures S2G and S2H; n = 92 tdTomato, 98 VIVIT. (D) Representative images of irg1:tdTomato and irg1:VIVIT-tdTomato larvae at 4 dpi. VIVIT-expressing larvae display reduced neovascular elaboration compared with tdTomato-only controls. (E) Quantitation of TDM-induced angiogenesis in irg1:VIVIT-tdTomato larvae compared with irg1:tdTomato larvae. Fish were injected with either TDM emulsified in IFA or IFA alone. Statistics were conducted by Dunn’s Kruskal-Wallis multiple comparisons test with Benjamini-Hochberg adjustment. Representative of three independent biological replicates. Additional replicates provided in Figures S2I and S2J; n = 59 tdTomato/IFA, 69 tdTomato/TDM, 62 VIVIT/IFA, 71 VIVIT/TDM. (F) Representative images of TDM-injected larvae from either irg1:VIVIT-tdTomato or irg1:tdTomato animals. The irg1:VIVIT-tdTomato condition displays a reduction in angiogenesis to the level of background while irg1:tdTomato fish induce a robust angiogenic response. Arrowheads indicate regions of neovascularization. |
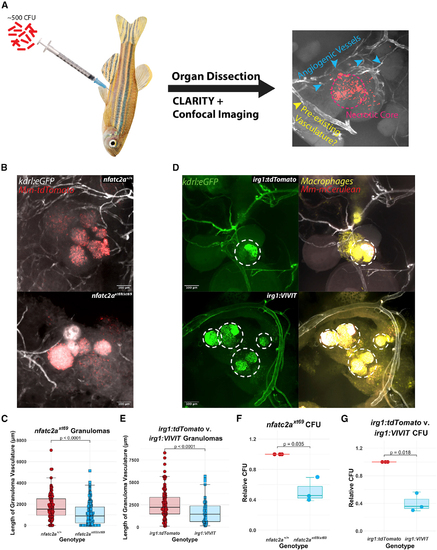
Angiogenesis in epithelioid granulomas depends on macrophage-NFAT signaling and nfatc2a (A) Schematic of adult infections. Adult zebrafish are infected with ∼500 CFU of fluorescent mycobacteria (Mm-mCerulean for irg1:VIVIT-tdTomato and irg1:tdTomato, Mm-tdTomato for nfatc2a) and after granulomas have established (≥14 dpi), peritoneal organs are harvested, fixed, and cleared of birefringent lipids. After confocal imaging and Z projection, various types of vasculature can be observed, including abnormal-appearing spindles and webs of vascular sprouts as well as more-established luminal vessels that potentially comprised the existing vascular network at that location. Dashed circle delineates necrotic core; blue arrowheads neovascularization; yellow arrowheads indicate thicker vasculature, which presumably was pre-existing. (B) Representative images of kdrl:eGFP; nfatc2axt69/xt69 and kdrl:eGFP; nfatc2a+/+ siblings. The extensive vascular network observed in wild-type animals is reduced in the nfatc2axt69/xt69 animals. Note that the vessels emerge in all three dimensions around and occasionally into the outer layers of the granuloma. (C) Quantitation of the total proximal vessel length in kdrl:eGFP; nfatc2axt69/xt69 and kdrl:eGFP; nfatc2a+/+ siblings 18 days after infection with 500 CFU. Each data point represents a single granuloma; n = 121 wild-type granulomas, 151 homozygous mutant granulomas over 6 separate animals per genotype. Representative of 3 independent experiments. Quantitation was performed under programmatic blinding. nfatc2axt69/xt69 fish display ∼40%–70% reduction in average sum vascular network length compared with wild-type siblings (see also Figures S3A and S3B). Statistics from Student’s t test. (D) Representative images of irg1:VIVIT-tdTomato; kdrl:eGFP and irg1:tdTomato; kdrl:eGFP granulomas. Dashed circles highlight the necrotic cores, which, due to both autofluorescence and leaky emission capture from the Mm-mCerulean bacteria, bleed into the GFP channel. irg1:tdTomato fish display robust interpenetration of blood vessels into and around the granuloma while little angiogenesis is seen in the irg1:VIVIT-tdTomato condition (see also Figure S3C). Note the large, luminal vessel in the irg1:VIVIT-tdTomato granuloma, which appears mature and may have existed preceding infection, but is included in quantitation. (E) Quantitation of the total vessel length in irg1:VIVIT-tdTomato; kdrl:eGFP and irg1:tdTomato; kdrl:eGFP granulomas. Each data point represents a single granuloma; n = 84 tdTomato, 74 VIVIT granulomas over 6 independent animals per genotype. Representative of three independent experiments. Quantitation was performed under programmatic blinding. irg1:VIVIT-tdTomato fish display a 30%–60% reduction in total vessel length compared with irg1:tdTomato (see also Figures S3D and S3E). Statistics are from Student’s t test. (F) Enumeration of bacterial burden from whole infected adult zebrafish 24 dpi. nfatc2axt69/xt69 and nfatc2a+/+ siblings were infected with 1,000 CFU Mm-tdTomato. The experiment was performed independently three times and each data point represents the median CFU from up to eight fish within a single experiment normalized to the wild-type siblings for that replicate. nfatc2axt69/xt69 fish had a ∼55% median reduction in CFU compared with wild type. Statistics from Student’s t test comparing median CFU values from each of three independent experiments, each with eight fish per genotype. (G) Enumeration of bacterial burden in whole infected adult zebrafish 18 dpi. irg1:VIVIT-tdTomato and irg1:tdTomato fish were infected with 1,000 CFU Mm-tdTomato. Each data point is the median CFU value from an independent experiment and each experiment contains up to eight fish of each genotype. irg1:VIVIT-tdTomato fish had a ∼65% median reduction in CFU compared with control fish. Statistics from Student’s t test comparing median CFU values from each of three independent experiments, each with eight fish per genotype. |
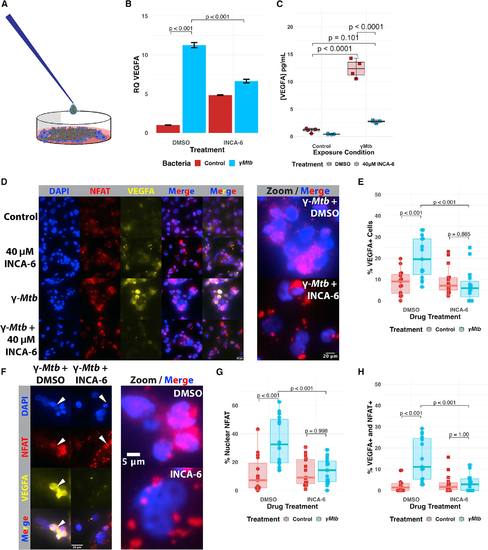
Pharmacological inhibition of NFAT in THP-1 human macrophages restricts VEGFA transcriptional induction and VEGFA production in response to Mtb (A) Pictorial representation of the γ-irradiated Mycobacterium tuberculosis (γMtb) exposure assay. Partially sonicated clumps of γMtb are overlaid on THP-1 monolayers to model a primarily extracellular route of exposure that might be seen during longer courses of infection, such as in the granuloma. (B) qRT-PCR analysis of γMtb-exposed THP-1 macrophages at 8 h post exposure. VEGFA transcripts are upregulated in response to γMtb/DMSO-treated cells, but this upregulation is suppressed by treatment with 40 μM INCA-6, a chemical inhibitor that interferes with calcineurin binding to NFAT. Each data point represents the mean relative quantity from three technical replicates for each biological replicate within the single experiment; representative of three independent experimental replicates. Additional replicates are provided in Figures S4A and S4B. Statistics from ANOVA with Tukey post-hoc honest significant differences test. (C) Supernatant ELISA of THP-1 macrophages at 24 h post exposure reveals potent induction of VEGFA only in the γMtb/DMSO-treated group. Representative of three independent experiments. Statistics from ANOVA with Tukey post-hoc honest significant differences test. (D) Immunofluorescence imaging reveals upregulation of VEGFA in γMtb-exposed THP-1 cells and substantial NFATC2 upregulation and nuclear translocation after treatment. Effects are both inhibited by treatment with INCA-6. DAPI channel labels nuclei; NFAT is detected by staining with anti-NFATC2 antibody; VEGFA detected by staining with anti-VEGFA antibody. Representative of three independent biological replicates. (E) Quantitation of the percentage of VEGFA+ cells within entire images for (D). The first five images from each experimental group were selected and computationally blinded. Total cell number was counted in addition to the number of VEGFA+ cells in each field. Each data point represents the percentage of VEGFA+ cells in the field; 15 (5 of each of 3 total replicates) total fields were counted for each groups (5 from each of 3 independent experiments). Total number of cells counted = 5,264. Statistics from ANOVA with Tukey honest significant differences test. (F) Magnified immunofluorescence images demonstrating VEGFA inhibition by addition of INCA-6 with γMtb-exposed THP-1 cells. Note the white arrows showing nuclear localization of NFATC2 corresponding with VEGFA signal in the DMSO-treated condition while NFATC2 nuclear localization is disrupted in the INCA-6 condition and little VEGFA can be observed. (G) Quantitation of the percentage of cells with nuclear NFAT residence from the same images as (F). Each data point represents the percentage of NFAT nuclear-resident cells in the field; 15 total fields were counted for each groups (5 from each of 3 independent experiments). Total number of cells counted = 5,264. Statistics from ANOVA with Tukey honest significant differences test. (H) Quantitation from (F and G) of the percentage of total cells with nuclear NFAT residence and also expressing VEGFA out of the total number of cells. Each point represents one of 15 total fields counted for each group (5 from each of 3 independent experiments). Total number of cells counted = 5,264. Statistics from ANOVA with Tukey honest significant differences test. |
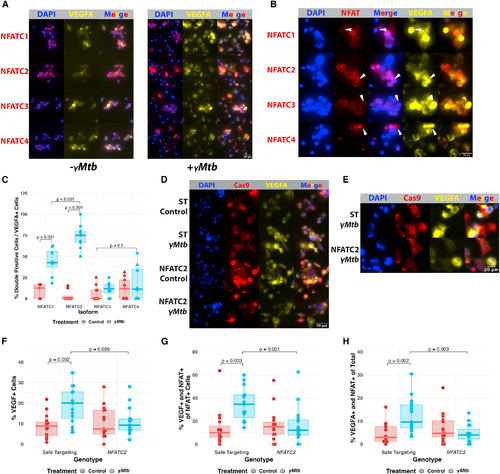
NFATC2 is required for the VEGFA response of cultured macrophages to γMtb exposure (A) Immunofluorescence staining of THP-1 macrophages in the presence or absence of γMtb to identify potential NFAT isoforms of interest in human cells. NFATC2 is most robustly expressed and inducibly nuclear of these isoforms in macrophages. NFATC1 and NFATC3 are comparatively less expressed and less extensively translocated by 8 h post exposure. NFATC4 is very lowly expressed initially but, like all the isoforms, appears to be upregulated at the protein level after γMtb exposure. Initial staining from a single experiment, with NFATC2 validation from three biological replicates in (D–G). (B) Magnified images showing robust VEGFA expression in cells with nuclear NFATC2 compared with cells with nuclear NFATC1, NFATC3, and NFATC4, which lack the strong correspondence between NFAT nuclear localization and VEGFA induction, which is only seen with NFATC2 staining. (C) Blinded quantitation of the relationship between each NFAT isoform and the induction of VEGFA. We calculated the subset of cells expressing both VEGFA and demonstrating obvious NFAT nuclear localization and normalized to the total number of cells expressing VEGFA in that field. Initial staining from a single experiment, with validation in (D–G). Total number of cells counted = 5,859. Statistics from ANOVA with Tukey honest significant differences test. (D) THP-1 cells transduced with Cas9-expressing lentiviruses targeting either NFATC2 (Figures S4F and S4G) or safe-targeting loci (Figure S4H) were selected with puromycin and then treated with γMtb or vehicle. Safe-targeting-transduced THP-1 cells robustly responded to γMtb with VEGFA production at 8 h post exposure, but fewer NFATC2-transduced cells produce VEGFA after stimulation and at lower staining intensity. Representative of three biological replicates. (E) Magnified images showing high VEGFA induction in γMtb-treated NFATC2-targeted THP-1 cells compared with γMtb-treated safe targeting (ST) THP-1 cells. The ST cells show robust VEGFA induction and NFAT nuclear translocation while NFATC2 cells show diminished VEGFA induction and disordered nuclear translocation and occasional lack of NFATC2 staining entirely; the antibody used to detect NFATC2 is N-terminal to the sgRNA sites, so residual expression is likely captured by the antibody. Representative of three biological replicates. (F) Blinded quantitation of the percentage of VEGFA+ cells within entire images for (D and E). Each data point represents the percentage of VEGFA+ cells in the field; 15 total fields were counted for each groups (5 from each of 3 independent experiments). Total number of cells counted = 5,029. Statistics from ANOVA with Tukey honest significant differences test. (G) Blinded quantitation of the percentage of VEGFA+ and nuclear-localized NFAT out of the total number of cells with NFAT nuclear localization within entire images for (D) and (E). Fifteen total fields were counted for each groups (5 from each of 3 independent experiments). Total number of cells counted = 5,029. Statistics from ANOVA with Tukey honest significant differences test. (H) Blinded quantitation of the percentage of VEGFA+ and nuclear-localized NFAT of the total number of cells in the images for (D) and (E). Fifteen total fields were counted for each group (5 from each of 3 independent experiments). Total number of cells counted = 5,029. Statistics from ANOVA with Tukey honest significant differences test. |