
Figure 6
- ID
- ZDB-FIG-230107-16
- Publication
- Zhang et al., 2022 - A Germline-Specific Regulator of Mitochondrial Fusion is Required for Maintenance and Differentiation of Germline Stem and Progenitor Cells
- Other Figures
- All Figure Page
- Back to All Figure Page
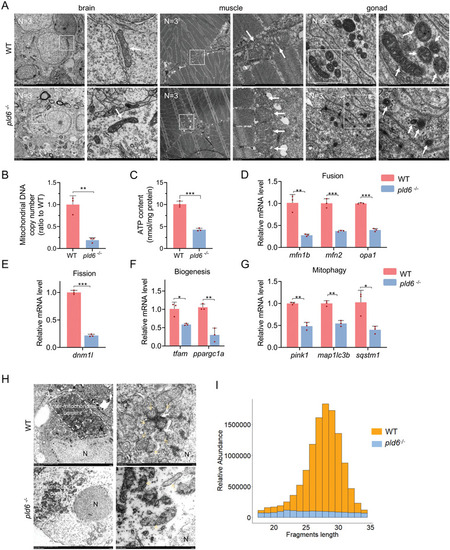
Imbalance of mitochondrial homeostasis and disruption of piRNA biogenesis in pld6‐deficient gonad. A) Mitochondria morphological observation of brain, muscle, and juvenile gonad in wildtype and pld6 −/‐ by the TEM. The box indicates the magnified area. The arrow points at mitochondria. N represents analyzed individual number. B) Comparison of mtDNA copy numbers between wildtype and pld6 −/‐ juvenile gonads. Every three gonads were mixed into a sample and three biological replicates were performed. C) Comparison of ATP content between wildtype and pld6 −/‐ juvenile gonads. Every three gonads were mixed into a sample and three biological replicates were performed. (D)RT‐qPCR detection of expressions of mitochondrial fusion factors (mfn1, mfn2 and opa1). E) RT‐qPCR detection of expression of mitochondrial fission factors (dnm1l). F) RT‐qPCR detection of expressions of mitochondrial biogenesis factors (tfam and ppargc1a). G) RT‐qPCR detection of expressions of mitochondrial mitophagy factors (pink1, map1lc3b, and sqstm1). H) TEM observation of aggregation of mitochondria around the nucleus and nuage formation in wildtype and pld6 −/− juvenile gonads. The dotted line indicates the inter‐mitochondrial cement. The yellow arrow points at the mitochondria. The white arrow points at the electron‐dense nuage. N represents analyzed individual number. I) Fragment length distribution of sequences cloned from wildtype and pld6 −/− mutant gonads at 22 dpf. piRNAs (26–31 nt) represent approximately 71.97% of the small RNA species between 18 and 34 nt in length in wildtype and only 36.48% in pld6 −/− mutant. The data were expressed as mean ± SD. The P values in this figure were calculated by two‐sided t‐test. *P < 0.05; **P <0.01; ***P <0.001; TEM, transmission electron microscope; RT‐qPCR, reverse‐transcription quantitative PCR. |