
- Title
-
A Germline-Specific Regulator of Mitochondrial Fusion is Required for Maintenance and Differentiation of Germline Stem and Progenitor Cells
- Authors
- Zhang, R., Tu, Y.X., Ye, D., Gu, Z., Chen, Z.X., Sun, Y.
- Source
- Full text @ Adv Sci (Weinh)
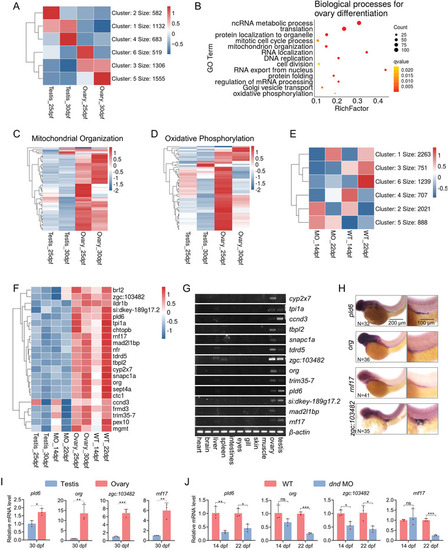
High expression of mitochondrial organization‐related genes in juvenile ovary. A) K‐means clustering of high‐variation genes in gonads. The genes of cluster 5 were highly expressed in the juvenile ovaries at 25 and 30 dpf. B) GO enrichment analysis of cluster 5 genes. C) Heatmap of mitochondrial organization‐related genes expression in juvenile ovary and testis at 25 and 30 dpf. D) Heatmap of oxidative phosphorylation‐related genes expression in juvenile ovary and testis at 25 and 30 dpf. E) K‐means clustering of high‐variation genes in trunks. The expression of cluster 4 genes was lower in dnd‐MO than in wildtype at 14 and 22 dpf. F) Heatmap of highly expressed genes overlapped between clusters 5 and 4 from gonads differentiating toward ovary. G) Detection of tissue‐specific gene expression by RT‐PCR. H) Detection of PGC‐specific gene expression by WISH. Scale bar: 200 µm for left; 100 µm for right. N represents analyzed embryo number. I) RT‐qPCR verification of differential expression of pld6, org, zgc:103482, and rnf17 in juvenile ovary and testis of wildtype. Every three gonads were mixed into a sample and three biological replicates were performed. J) RT‐qPCR verification of differential expression of pld6, org, zgc:103482, and rnf17 in gonads of wildtype and dnd‐MO. Every three gonads were mixed into a sample and three biological replicates were performed. The data were expressed as mean ± SD. The P values in this figure were calculated by two‐sided t‐test. *P < 0.05; **P < 0.01; ***P < 0.001; MO, morpholino; WISH, whole‐mount in situ hybridization; PGC, primordial germ cell; dpf, days post fertilization; RT‐qPCR, reverse‐transcription quantitative PCR. |
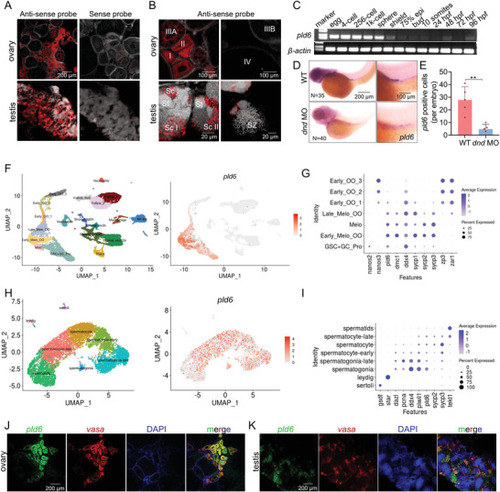
Specific expression of zebrafish pld6 in germline. A,B) In situ hybridization of ovary and testis cryosections with pld6 probe. Scale bar: 200 µm for A; 100 µm for B up; 20 µm for B down. C) Expression detection of pld6 in early embryonic stage by RT‐PCR. D) Expression detection of pld6 in wildtype and dnd‐knockdown 3 dpf embryos by WISH. N represents analyzed embryo number. E) Statistical analysis of pld6‐positive cells in wildtype and dnd‐knockdown 3 dpf embryos in panel D. F) The exhibition of 19 cell types in the ovary at 40 dpf by UMAP (left). The distribution of pld6‐expressed cells (right). G) Expression of ten marker genes (nanos2, nanos3, pld6, dmc1, ddx4, sycp1, sycp2, sycp3, zp3, and zar1) in the germ cells at different stages. H) The exhibition of 8 cell types in the adult testis by UMAP (left). The distribution of pld6‐expressed cells (right). I) Expression of ten marker genes (gsdf, star, dazl, pcna, ddx4, piwil1, sycp2, sycp3 and tekt1) in the somatic cells and germ cells at different stages. J) Two‐color fluorescent in situ hybridization of adult ovary with probes of pld6 and vasa. Scale bar: 200 µm. K) Two‐color fluorescent in situ hybridization of adult testis with probes of pld6 and vasa. Scale bar: 200 µm. The data were expressed as mean ± SD. The P values in this figure were calculated by two‐sided t‐test. **P < 0.01; MO, morpholino; WISH, whole‐mount in situ hybridization; dpf, days post fertilization. |

Masculinization and infertility induced by pld6 deficiency in zebrafish. A) Schematic of zebrafish pld6 genome locus and the gRNA target. Red font indicates gRNA target sequences. B) RT‐qPCR analysis of pld6 expression in 22 dpf gonads of pld6‐null mutant. C) Morphological and anatomical analyses of wildtype and pld6‐null mutant. D) Sex ratio of wildtype and pld6 −/− groups. N represents analyzed individual number. E,F) Comparison of body length and body weight between wildtype and mutant. G) Comparison of fertilization rates between wildtype and mutant. H) Comparison of the GSI between wildtype males and mutant males. I) Anti‐vasa immunostaining and in situ hybridization of wildtype and mutant testis with probes of gsdf and insl3. Scale bar: 50 µm for Vasa, 200 µm for gsdf and insl3. N represents analyzed individual number. The data were expressed as mean ± SD. The P values in this figure were calculated by two‐sided t‐test. *P < 0.05; ***P < 0.001; and ns, no significant difference; RT‐qPCR, reverse‐transcription quantitative PCR; GSI, gonadosomatic index. |
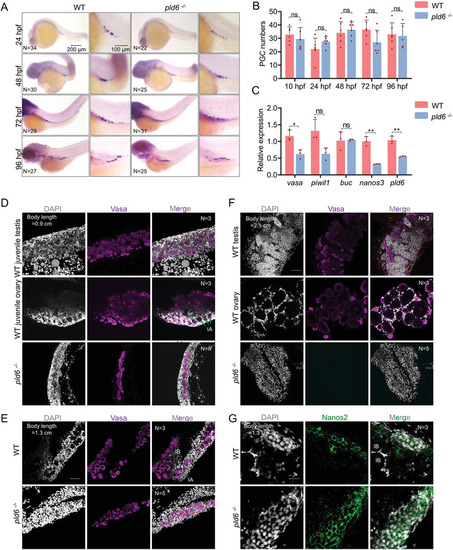
Tracing of gonad development in pld6 mutant. A) Comparison of PGC numbers between wildtype and mutant by WISH with vasa probe. WISH was performed on embryos at 24, 48, 72, and 96 hpf. N represents analyzed embryo number. B) Statistical analysis of total PGC numbers in wildtype and pld6 −/− embryos. C) RT‐qPCR detection of the expression of germ plasm factors (vasa, piwil1, buc, and nanos3) in wildtype and pld6 −/− larvae. The decreased expression level of pld6 was set as positive control. D–F) Tracing of germ cell development in wildtype and pld6 −/‐ juvenile gonads at 22 dpf (D), 30 dpf (E), and 45 dpf (F). Anti‐vasa staining was performed to label the germ cells, and DAPI staining was performed to label the nuclear. Green arrows marked the stage IA and IB oocytes. N represents analyzed individual number. Scale bar: 100 µm. G) Anti‐Nanos2 immunostaining of wildtype and mutant gonads at 30 dpf. N represents analyzed individual number. Scale bar: 20 µm. The data were expressed as mean ± SD. The P values in this figure were calculated by two‐sided t‐test. *P < 0.05; ***P < 0.001; ns, no significant difference; PGC, primordial germ cell; WISH, whole‐mount in situ hybridization; hpf, hours post fertilization; dpf, days post fertilization; RT‐qPCR, reverse‐transcription quantitative PCR. |
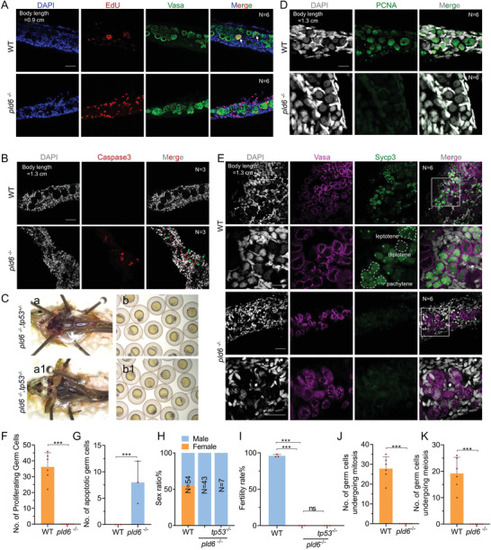
Blocking of germ cell self‐renewal and differentiation in pld6‐ depleted gonad. A) EdU staining of proliferating cells in wildtype and pld6 −/‐ juvenile gonads. The germ cells were marked by anti‐vasa immunostaining. N represents analyzed individual number. Scale bar: 100 µm. B) Apoptosis detection in wildtype and pld6 −/− juvenile gonads by anti‐Caspase3 immunostaining. N represents analyzed individual number. Scale bar: 100 µm. C)Morphological observation of gonads and offspring of pld6 −/− and pld6 −/−; tp53−/− double mutant. D) Detection of mitosis in wildtype and pld6 −/‐ juvenile gonads by anti‐Pcna immunostaining. N represents analyzed individual number. Scale bar: 100 µm. E) Detection of meiosis in wildtype and pld6 −/− juvenile gonads by anti‐Sycp3 immunostaining. N represents analyzed individual number. Scale bar: 100 µm. F) Statistical analysis of total number of proliferating germ cells. G) Statistical analysis of the total number of apoptotic germ cells. H) Sex ratio of wildtype, pld6−/− , and pld6 −/−; tp53−/− double mutant. I) Fertilization rates of wildtype, pld6−/− and pld6 −/−; tp53−/− double mutant. J) Statistical analysis of the total number of germ cells undergoing mitosis. K) Statistical analysis of the total number of germ cells undergoing meiosis. The data were expressed as mean ± SD. The P values in this figure were calculated by two‐sided t‐test. ***P < 0.001; ns, no significant difference. |
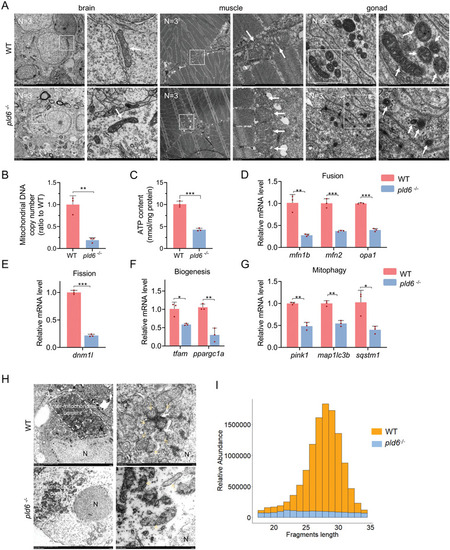
Imbalance of mitochondrial homeostasis and disruption of piRNA biogenesis in pld6‐deficient gonad. A) Mitochondria morphological observation of brain, muscle, and juvenile gonad in wildtype and pld6 −/‐ by the TEM. The box indicates the magnified area. The arrow points at mitochondria. N represents analyzed individual number. B) Comparison of mtDNA copy numbers between wildtype and pld6 −/‐ juvenile gonads. Every three gonads were mixed into a sample and three biological replicates were performed. C) Comparison of ATP content between wildtype and pld6 −/‐ juvenile gonads. Every three gonads were mixed into a sample and three biological replicates were performed. (D)RT‐qPCR detection of expressions of mitochondrial fusion factors (mfn1, mfn2 and opa1). E) RT‐qPCR detection of expression of mitochondrial fission factors (dnm1l). F) RT‐qPCR detection of expressions of mitochondrial biogenesis factors (tfam and ppargc1a). G) RT‐qPCR detection of expressions of mitochondrial mitophagy factors (pink1, map1lc3b, and sqstm1). H) TEM observation of aggregation of mitochondria around the nucleus and nuage formation in wildtype and pld6 −/− juvenile gonads. The dotted line indicates the inter‐mitochondrial cement. The yellow arrow points at the mitochondria. The white arrow points at the electron‐dense nuage. N represents analyzed individual number. I) Fragment length distribution of sequences cloned from wildtype and pld6 −/− mutant gonads at 22 dpf. piRNAs (26–31 nt) represent approximately 71.97% of the small RNA species between 18 and 34 nt in length in wildtype and only 36.48% in pld6 −/− mutant. The data were expressed as mean ± SD. The P values in this figure were calculated by two‐sided t‐test. *P < 0.05; **P <0.01; ***P <0.001; TEM, transmission electron microscope; RT‐qPCR, reverse‐transcription quantitative PCR. |
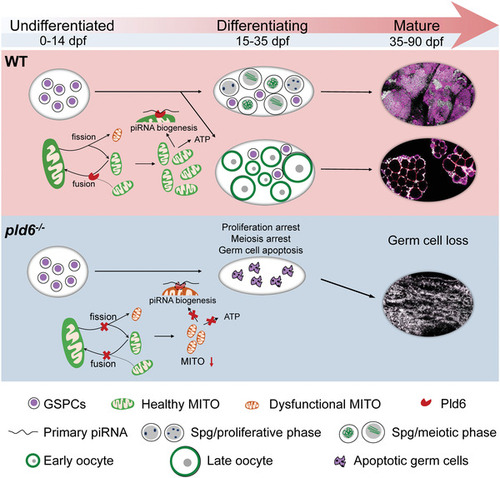
A graphic summary of the role of pld6 in germ cell development. During zebrafish sex differentiation, Pld6 regulates the mitochondrial fusion and fission in germ cells, leading to the sufficiency of energy supply and the stabilization of piRNA biosynthesis. In wildtype, pld6 safeguards the health of mitochondria and facilitates the generation of sufficient mitochondria in GSPCs thus promotes the differentiation of juvenile gonads and the maturation of ovary and testis. In mutant, loss of pld6 leads to the scanty amount and dysfunctional mitochondria in GSPCs, further leads to the germ cell apoptosis, and arrest of meiosis and proliferation during gonad differentiation. Therefore, a GSPCs‐specific pld6 mediate‐mitochondrial fusion and piRNA biogenesis promotes survival, proliferation, and differentiation of GSPCs. |