
FIGURE
Fig. 4
- ID
- ZDB-FIG-221226-242
- Publication
- Maradonna et al., 2022 - A zebrafish HCT116 xenograft model to predict anandamide outcomes on colorectal cancer
- Other Figures
- All Figure Page
- Back to All Figure Page
Fig. 4
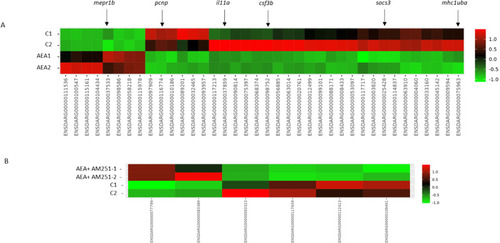
A AEA vs. Ctrl. B AEA + AM251 vs. Ctrl. Color scales represent fold-change between two groups as described (green = downregulation, red = upregulation). Only significant DEGs (FDR < = 0.05) have been included. Arrows show DEGs analyzed in this study. |
Expression Data
Expression Detail
Antibody Labeling
Phenotype Data
Phenotype Detail
Acknowledgments
This image is the copyrighted work of the attributed author or publisher, and
ZFIN has permission only to display this image to its users.
Additional permissions should be obtained from the applicable author or publisher of the image.
Full text @ Cell Death Dis.