
Fig. 2
- ID
- ZDB-FIG-221226-240
- Publication
- Maradonna et al., 2022 - A zebrafish HCT116 xenograft model to predict anandamide outcomes on colorectal cancer
- Other Figures
- All Figure Page
- Back to All Figure Page
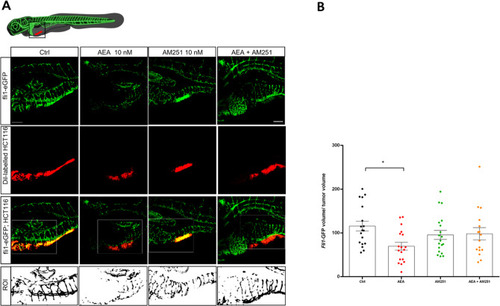
A Representative confocal z-stack images of 5 dpf (3 dpi) larvae with the tumor highlighted by the red fluorescence (Dil Vibrant red staining) and blood vessels marked by the green fluorescence (Tg(fli1:EGFP)y1 line). Scale bar 100 µm. The white box indicates the region of interest (ROI) selected to quantify the vascularization. B Quantification of total green fluorescence of the ROI analyzed with Fiji. The mean value in the Ctrl was settled as 100%. The error bar indicates SEM. Statistical analysis was performed using one-way ANOVA. *p < 0.05; (Ctrl n = 18; AEA n = 18; AM251 n = 19; AEA + AM251 n = 16 from three independent experiments). Image created with Biorender.com. |