
Figure 1
- ID
- ZDB-FIG-221211-169
- Publication
- Amin et al., 2022 - Cannabinoid receptor 2 (Cb2r) mediates cannabinol (CBN) induced developmental defects in zebrafish
- Other Figures
- All Figure Page
- Back to All Figure Page
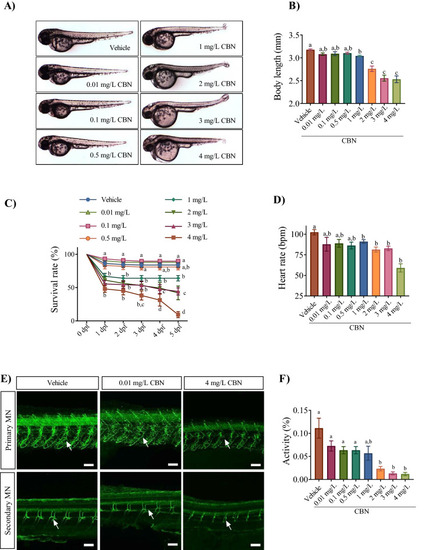
Embryos exposed to CBN during gastrulation show morphological and neuronal deficits. (A) Images of embryos exposed to 0.4% methanol (vehicle), 0.01 mg L−1, 0.1 mg L−1, 0.5 mg L−1, 1 mg L−1, 2 mg L−1, 3 mg L−1 and 4 mg L−1 CBN (from 5.25 to 10.75 hpf) and then allowed to develop in normal embryo media. Images were taken at 48–52 hpf. (B) Bar graph showing the mean body lengths (in mm) of embryos exposed to different media: vehicle control (n = 57), 0.01 mg L−1 (n = 61), 0.1 mg L−1 (n = 61), 0.5 mg L−1 (n = 61), 1 mg L−1 (n = 42), 2 mg L−1 (n = 30), 3 mg L−1 (n = 29) and 4 mg L−1 CBN (n = 21) respectively at 2 dpf. N = 3 experiments. (C) Line graphs showing the mean percentage of embryos that survived within the first 5 days of development following exposure to different media: vehicle, 0.01 mg L−1 CBN, 0.1 mg L−1 CBN, 0.5 mg L−1 CBN, 1 mg L−1 CBN, 2 mg L−1 CBN, 3 mg L−1 CBN and 4 mg L−1 CBN during gastrulation (N = 4 experiments and n = 20 embryos for each treatment). (D) Bar graphs of heart rate of embryos exposed to different media: vehicle control (n = 82), 0.01 mg L−1 (n = 61), 0.1 mg L−1 (n = 23), 0.5 mg L−1 (n = 29), 1 mg L−1, 2 mg L−1, 3 mg L−1 and 4 mg L−1 CBN (n = 45) respectively; N = 3 experiments. (E) Top panel, anti-znp-1 antibody was used to label primary motor neuron axons and their branches (green) in embryos exposed to vehicle control (n = 5), 0.01 mg L−1 CBN (n = 7), and 4 mg L−1 CBN (n = 7). Branches in a motor axon are indicated with white arrow. Bottom panel, anti-zn8 antibody was used to label secondary MN and their branches (green) in embryos exposed to vehicle control (n = 5), 0.01 mg L−1 CBN (n = 7), and 4 mg L−1 CBN (n = 7). Scale bar represents 50 µm. Branches in a motor axon are indicated with white arrow. N = 3 experiments. (F) Bar graph shows mean activity (%) for embryos exposed to different media: vehicle control (n = 82), 0.01 mg L−1 (n = 61), 0.1 mg L−1 (n = 23), 0.5 mg L−1 (n = 29), 1 mg L−1, 2 mg L−1, 3 mg L−1 and 4 mg L−1 CBN (n = 45) respectively. N = 4 experiments. Groups which share the same letter(s) of the alphabet are not statistically different from one another; p < 0.05. |