
- Title
-
Cannabinoid receptor 2 (Cb2r) mediates cannabinol (CBN) induced developmental defects in zebrafish
- Authors
- Amin, M.R., Ahmed, K.T., Ali, D.W.
- Source
- Full text @ Sci. Rep.
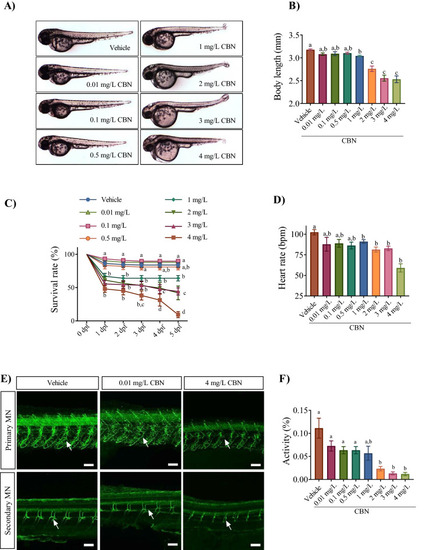
Embryos exposed to CBN during gastrulation show morphological and neuronal deficits. (A) Images of embryos exposed to 0.4% methanol (vehicle), 0.01 mg L−1, 0.1 mg L−1, 0.5 mg L−1, 1 mg L−1, 2 mg L−1, 3 mg L−1 and 4 mg L−1 CBN (from 5.25 to 10.75 hpf) and then allowed to develop in normal embryo media. Images were taken at 48–52 hpf. (B) Bar graph showing the mean body lengths (in mm) of embryos exposed to different media: vehicle control (n = 57), 0.01 mg L−1 (n = 61), 0.1 mg L−1 (n = 61), 0.5 mg L−1 (n = 61), 1 mg L−1 (n = 42), 2 mg L−1 (n = 30), 3 mg L−1 (n = 29) and 4 mg L−1 CBN (n = 21) respectively at 2 dpf. N = 3 experiments. (C) Line graphs showing the mean percentage of embryos that survived within the first 5 days of development following exposure to different media: vehicle, 0.01 mg L−1 CBN, 0.1 mg L−1 CBN, 0.5 mg L−1 CBN, 1 mg L−1 CBN, 2 mg L−1 CBN, 3 mg L−1 CBN and 4 mg L−1 CBN during gastrulation (N = 4 experiments and n = 20 embryos for each treatment). (D) Bar graphs of heart rate of embryos exposed to different media: vehicle control (n = 82), 0.01 mg L−1 (n = 61), 0.1 mg L−1 (n = 23), 0.5 mg L−1 (n = 29), 1 mg L−1, 2 mg L−1, 3 mg L−1 and 4 mg L−1 CBN (n = 45) respectively; N = 3 experiments. (E) Top panel, anti-znp-1 antibody was used to label primary motor neuron axons and their branches (green) in embryos exposed to vehicle control (n = 5), 0.01 mg L−1 CBN (n = 7), and 4 mg L−1 CBN (n = 7). Branches in a motor axon are indicated with white arrow. Bottom panel, anti-zn8 antibody was used to label secondary MN and their branches (green) in embryos exposed to vehicle control (n = 5), 0.01 mg L−1 CBN (n = 7), and 4 mg L−1 CBN (n = 7). Scale bar represents 50 µm. Branches in a motor axon are indicated with white arrow. N = 3 experiments. (F) Bar graph shows mean activity (%) for embryos exposed to different media: vehicle control (n = 82), 0.01 mg L−1 (n = 61), 0.1 mg L−1 (n = 23), 0.5 mg L−1 (n = 29), 1 mg L−1, 2 mg L−1, 3 mg L−1 and 4 mg L−1 CBN (n = 45) respectively. N = 4 experiments. Groups which share the same letter(s) of the alphabet are not statistically different from one another; p < 0.05. |

CBN exposure alters the development of hair cells associated with the otoliths and the lateral line. (A) Bar graph represents the (%) of embryos that responded to sound/vibration stimuli at 5 dpf. The sound/vibration pulse was delivered to free-swimming embryos from a speaker that was in contact with the base platform and their escape responses were recorded. N = 3 experiments. (B) Images of otoloths were taken from 52 hpf old embryos, positioning anterior (head) on right and posterior (tail) on left. The otic vesicles (OV), utricular otolith (UO) and saccular otolith (SO) and semicircular canal (SC) are visible here. N = 3 experiments. Scale bar represents 50 µm. (C) Scanning electron microscopy (SEM) images of embryos at 5 dpf. Top rows, images were taken of the otolith at ×500 magnification. Bottom rows, images were taken from inside the otolith at ×10,000 magnification. Kinocilia can be seen emanating from hair cells. Scale bar represents 100 µm (top panel) and 5 µm (bottom panel). N = 3 experiments. (D) Bar graph of vehicle controls (n = 6), 0.01 mg L−1 (n = 8) and 4 mg L−1 (n = 8) groups showing the % of embryos that exhibited changes to the tight bundled structure of kinocilia. N = 3 experiments. (E) SEM images of embryos along the posterior lateral line (pLL) at 5 dpf. Top row shows images of vehicle control, 0.01 mg L−1 CBN and 4 mg L−1 CBN treated groups. Images were taken of the lateral line at ×500 magnification. Bottom row shows the SEM image of the first neuromast along the lateral line. These images were taken at ×10,000 magnification. Scale bar represents 100 µm (top panel) and 5 µm (bottom panel). N = 3 experiments. (F) Bar graph showing the number of neuromasts along the posterior lateral line in vehicle controls (n = 6), 0.01 mg L−1 (n = 6) and 4 mg L−1 (n = 6) groups. N = 3 experiments. Groups which share the same letter(s) of the alphabet are not statistically different from one another; p < 0.05. |

Blocking Cb2r prevents the CBN-induced deficits in morphology and survival. (A) Images of embryos at 2 dpf in the presence and absence of Cb1r and Cb2r antagonists with CBN. N = 3 experiments. (B) Bar graph shows the mean body length (mm) of embryos for one set of antagonists (AM251 and AM630 for Cb1r and Cb2r respectively) in vehicle control (n = 57), 3 mg L−1 CBN (n = 29), AM251 10 nm + 3 mg L−1 CBN (n = 21), AM630 10 µm + 3 mg L−1 CBN (n = 21) and AM251 10 nm + AM630 10 µm + 3 mg L−1 CBN (n = 36) respectively at 2 dpf (N = 3 experiments). (C) Bar graph shows the mean body length (mm) of embryos for the second set of antagonists (Cp94 and JTE907 for Cb1r and Cb2r respectively). The bars represent vehicle control (n = 57), 3 mg L−1 CBN (n = 29), CP94 10 nm + 3 mg L−1 CBN (n = 31), JTE907 10 µm + 3 mg L−1 CBN (n = 234) and Cp94 10 nm + JTE907 10 µm + 3 mg L−1 CBN (n = 31) at 2 dpf. N = 3 experiments. (D) Line graph showing the percentage of embryos that survived within the first 5 days of development following co-exposure of the first set of antagonists and CBN. Treatments are vehicle control, 3 mg L−1 CBN, AM251 10 nm + 3 mg L−1 CBN, AM630 10 µm + 3 mg L−1 CBN and AM251 10 nm + AM630 10 µm + 3 mg L−1 CBN (N = 4 experiments and n = 25 embryos for each experiment). (E) Line graph showing the percentage of embryos that survived within the first 5 days of development following co-exposure of the second set of antagonists and CBN. Treatments are vehicle control, 3 mg L−1 CBN, CP94 10 nm + 3 mg L−1 CBN, JTE907 10 µm + 3 mg L−1 CBN and Cp94 10 nm + JTE907 10 µm + 3 mg L−1 CBN (N = 4 experiments and n = 25 embryos for each treatment). (F) Bar graphs show the mean heart rate in beats per minute (bpm) at 2 dpf for vehicle control (n = 35), 3 mg L−1 CBN (n = 59), AM251 10 nm + 3 mg L−1 CBN (n = 32), AM630 10 µm + 3 mg L−1 CBN (n = 33) and AM251 10 nm + AM630 10 µm + 3 mg L−1 CBN (n = 20) respectively. N = 4 experiments. (G) Bar graphs show heart rate as beats per minute (bpm) at 2 dpf for vehicle control (n = 35), 3 mg L−1 CBN (n = 59), CP94 10 nm + 3 mg L−1 CBN (n = 21), JTE907 10 µm + 3 mg L−1 CBN (n = 25) and Cp94 10 nm + JTE907 10 µm + 3 mg L−1 CBN (n = 20) respectively. N = 4 experiments. Groups which share the same letter(s) of the alphabet are not statistically different from one another; p < 0.05. |

Combined exposure of Cb2r and CBN inhibits CBN-induced changes in primary motor neuron branching. (A) Znp-1 (green) antibody was used to label primary motor neuron axons and their branches in vehicle control (n = 7), 3 mg L−1 CBN (n = 9), AM251 10 nm + 3 mg L−1 CBN (n = 8), CP94 10 nm + 3 mg L−1 CBN (n = 9), AM630 10 µm + 3 mg L−1 CBN (n = 9), JTE907 10 µm + 3 mg L−1 CBN (n = 8), AM251 10 nm + AM630 10 µm + 3 mg L−1 CBN (n = 5) and Cp94 10 nm + JTE907 10 µm + 3 mg L−1 CBN (n = 6). Dorsal and ventral branches in a motor axon are indicated with (D) and (V) respectively, and the white arrow points to secondary branches in the vehicle image. N = 3 experiments; Scale bar represents 25 µm. (B,C) Bar graph shows the number of secondary branches in the dorsal and ventral regions of the trunk. N = 3 experiments. Groups which share the same letter(s) of the alphabet are not statistically different from one another; p < 0.05. |
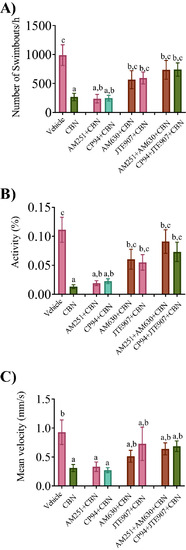
Combined exposure of Cb2r with CBN prevents the CBN-induced deficits in locomotion. The free swimming movement of the fish was recorded for 60 min and the recorded video was analyzed later. Tracing was recorded at 5 dpf for vehicle control (n = 18), 3 mg L−1 CBN (n = 25), AM251 10 nm + 3 mg L−1 CBN (n = 37), CP94 10 nm + 3 mg L−1 CBN (n = 31), AM630 10 µm + 3 mg L−1 CBN (n = 32), JTE907 10 µm + 3 mg L−1 CBN (n = 37), AM251 10 nm + AM630 10 µm + 3 mg L−1 CBN (n = 36) and Cp94 10 nm + JTE907 10 µm + 3 mg L−1 CBN (n = 40) respectively. N = 4 experiments. (A) Bar graph shows the mean frequency of swim bouts within 1 h. (B) Bar graph shows the mean swimming activity (%) in 1 h. (C) Bar graph shows the mean swimming velocity (mm s−1) over a 1 h time period. Groups which share the same letter(s) of the alphabet are not statistically different from one another; p < 0.05. |

Blocking Cb1r and Cb2r prevents the CBN-induced changes in otolith hair cell development. (A) Bar graph shows the mean percentage of animals that responded to sound/vibration stimulus in the presence or absence of receptor blockers and CBN in 5 dpf larvae. The response to sound stimuli (C-bend) was recorded following exposure to sound and analyzed later for calculating response rate (%). N = 3 experiments. (B) SEM images were taken of the head i.e. anterior lateral line (aLL). (B) Images were taken at ×500 magnification for 3 mg L−1 CBN (n = 5), AM251 10 nm + 3 mg L−1 CBN (n = 5), AM630 10 µm + 3 mg L−1 CBN (n = 5) and AM251 10 nm + AM630 10 µm + 3 mg L−1 CBN (n = 5) respectively. Scale bar represents 20 µm. (C) Bar graph showing the quantification of the percentage of the embryos that exhibited deformities in the kinocilia associated with the otoliths. Groups which share the same letter(s) of the alphabet are not statistically different from one another; p < 0.05. |
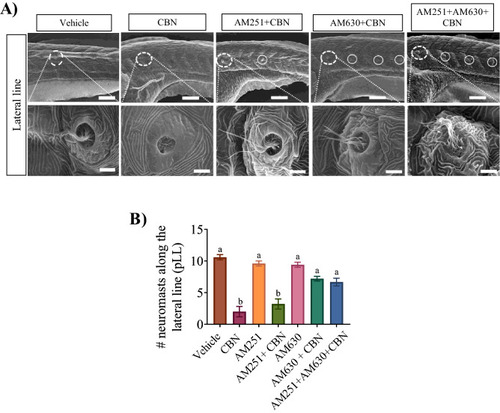
Blocking Cb1r and Cb2r activity prevents the CBN-induced changes in hair cell development along the pLL. (A) Images are taken along the pLL at ×500 magnification for 3 mg L−1 CBN (n = 5), AM251 10 nm + 3 mg L−1 CBN (n = 5), AM630 10 µm + 3 mg L−1 CBN (n = 5) and AM251 10 nm + AM630 10 µm + 3 mg L−1 CBN (n = 5). Scale bar represents 100 µm for the top row. N = 3 experiments. The bottom row shows higher magnification images of the pLL (×10,000 magnification). Scale bar represents 5 µm. (I) Bar graph showing the quantification of the percentage of the embryos that exhibited deformities in their hair cell along pLL. N = 3 experiments. Groups which share the same letter(s) of the alphabet are not statistically different from one another; p < 0.05. |