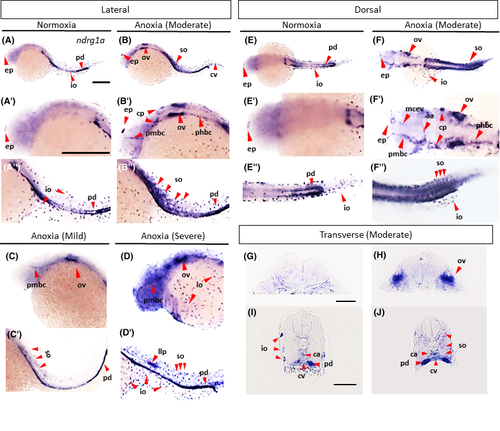
Analysis of ndrg1a expression in zebrafish embryos following 8 h of anoxia. Wholemount in situ hybridization analysis revealing the distribution of ndrg1a transcript in 24 hpf zebrafish embryo exposed to 8 h of anoxia (B–B″, C–C′, D–D′, F–F″, H, J) relative to normoxic (stage-matched controls) (A–A″, E–E″, G, I) imaged from a lateral view (A–D′), a dorsal view (E–F″) and cross-sectional (G–J) views through the otic vesicles (G,H) and the trunk (I,J). (A′–B″, E–F″ are magnified views of (A,B,E,F). The mild (C,C′) and severe (D,D′) transcriptional responses are included to compare with the moderate response (B–B″, F–F″). aa, aortic arch; cp, cranial placodes; cv, caudal vein; da, dorsal aorta; ep, epiphysis; hgc, hatching gland cells; io, ionocyte; llp, lateral line primordium; mcev, mid-cerebral vein; ov, otic vesicle; pcv, posterior cardinal vein; pmbc, primordial midbrain channel; pd, pronephric ducts; so, somites. The experiment was repeated in triplicate, with eight embryos representative of the group imaged. Scale bar in A,A′, 250 μm. Scale bar in G,I, 50 μm
|
