
Fig. 5
- ID
- ZDB-FIG-221115-19
- Publication
- Silic et al., 2021 - Phylogenetic and developmental analyses indicate complex functions of Calcium-Activated Potassium Channels in zebrafish embryonic development
- Other Figures
- All Figure Page
- Back to All Figure Page
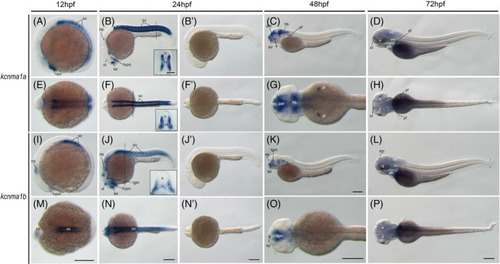
The kcnma1 genes (BK) during zebrafish early embryogenesis. Whole‐mount in situ hybridization of zebrafish embryos at stages 12hpf (A,E,I,M), 24hpf (B,F,J,N,B′,F′,J′,N′), 48hpf (C, G, K, O), and 72hpf (D, H, L, P). Sense riboprobe controls (B′,F′,J′,N′) do not show any specific staining at 24hpf. Anterior is to the left in all the whole‐mount images, and dorsal is to the top in all transverse sections. The dashed lines indicate the positions of sections. The section images were shown in the insert of corresponding panels. A‐D, Lateral view of gene expression of kcnma1a. E‐H, Dorsal view of gene expression of kcnma1a. I‐L, Lateral view of gene expression of kcnma1b. M‐P, Dorsal view of gene expression of kcnma1b. Scale bars are added on the bottom row of images; 250 μm for whole‐mount images and 50 μm for tissue sections. e, eye; ep, epiphysis; hb, hindbrain; hypo, hypothalamus; n, neural tube; nt, notochord; ol, olfactory placodes/organ; op, optic vesicle; ot, optic tectum; ov, otic vesicle; pal, pallium; pf, pectoral fin; ph, pharyngeal arches; so, somite; tb, tailbud; tel, telencephalon; tgm, tegmentum |
| Genes: | |
|---|---|
| Fish: | |
| Anatomical Terms: | |
| Stage Range: | 5-9 somites to Protruding-mouth |