
Fig 5
- ID
- ZDB-FIG-221105-6
- Publication
- Li et al., 2022 - Mycn regulates intestinal development through ribosomal biogenesis in a zebrafish model of Feingold syndrome 1
- Other Figures
- All Figure Page
- Back to All Figure Page
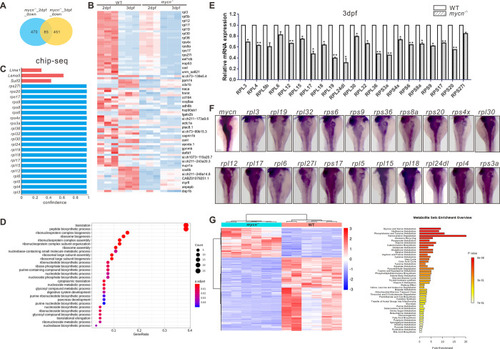
Multiomics analysis in the mycn mutant and WT embryos.
(A) Venn diagram of the down-regulated genes in mycn mutants compared with WT at 2 and 3 dpf. The number of congruently down-regulated genes is shown in the middle. (B) Heatmap showing the scaled expression patterns of 85 down-regulated genes (identified in A) in mycn mutant and WT embryos at 2 and 3 dpf. Color scale: red, high expression; blue, low expression. (C) Bar plot shows the confidence interval of a portion of the rpl and rps genes that were direct downstream targets of MYCN analyzed by ChIP-seq of MYCN in the mouse ESC from published datasets [31]. These genes were also been found down-regulated in the mycn mutants by bulk RNA-seq analysis. (D) Dot plot showing enriched GO terms of the 85 down-regulated genes in the mycn mutants. The size and color intensity of each dot represents the gene counts in each enriched GO term and the adjusted p-value, respectively. (E) qPCR verification of the down-regulated rpl and rps genes at 3 dpf in WT and mycn mutant embryos. Asterisks indicate that the significant difference by Student t test. **p < 0.001; *p < 0.05. (F) Expression patterns of rpl and rps genes and mycn in the digestive organs of WT embryos at 3 dpf via WISH (images shown in dorsal view). (G) Metabolite analysis of the mycn mutant and WT embryos. The heatmap shows the expressions of different substances in mycn mutant and WT embryos after normalizing the intensity value of each metabolite. Bar plot shows the KEGG pathway enrichment and enrichment significance calculated by analysis of differential metabolites between the mycn mutant and WT embryos. Fold enrichment is the ratio of the number of metabolites matching the pathway during enrichment analysis to the number of theoretical metabolites distributed to the pathway of random distribution. Enrichment significance is indicated by color in the histogram according to p-value. Scale bar: 100 μm. The data underlying this figure can be found in S1 and S2 Data. dpf, days postfertilization; ESC, embryonic stem cell; GO, gene ontology; WISH, whole mount in situ hybridization; WT, wild-type. |