
- Title
-
Mycn regulates intestinal development through ribosomal biogenesis in a zebrafish model of Feingold syndrome 1
- Authors
- Li, Y.F., Cheng, T., Zhang, Y.J., Fu, X.X., Mo, J., Zhao, G.Q., Xue, M.G., Zhuo, D.H., Xing, Y.Y., Huang, Y., Sun, X.Z., Wang, D., Liu, X., Dong, Y., Zhu, X.S., He, F., Ma, J., Chen, D., Jin, X., Xu, P.F.
- Source
- Full text @ PLoS Biol.
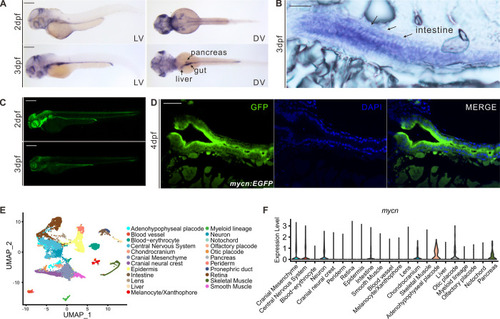
mycn expression patterns in zebrafish during early development.
(A) Expression patterns of mycn in zebrafish at 2 and 3 dpf by whole-mount WISH. Lateral view (left), dorsal view (right). (B) mycn expressed along the whole intestines of the embryos at 3 dpf shown by section via ISH. Arrows indicate the embryo intestines. Sections were cut along the sagittal plane. (C) Fluorescence images show the mycn expression patterns by EGFP-knock-in fish at 2 and 3 dpf (lateral view). (D) mycn expressed along the whole intestines of the zebrafish at 4 dpf shown by section of mycn:EGFP fish. (E) UMAP plot shows unsupervised clustering of the cells in WT embryos of 3 dpf; cells are colored by their cell type annotations. (F) Violin plots show the mycn expression levels of different cell types of WT embryonic scRNA-seq data at 3 dpf. Scale bars: 200 μm (A and C), 50 μm (B and D). dpf, days postfertilization; ISH, in situ hybridization; scRNA-seq, singe-cell RNA-seq; UMAP, uniform manifold approximation and projection; WISH, whole mount in situ hybridization; WT, wild-type. |
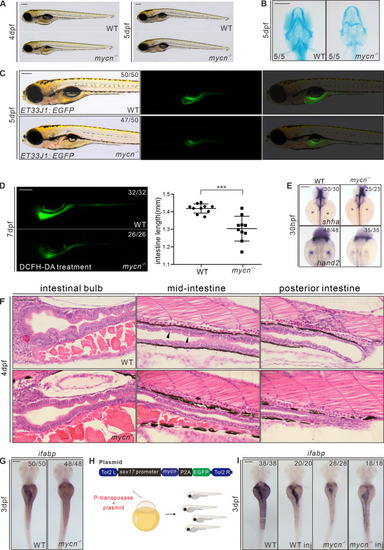
Phenotypic analysis of mycn mutants.
(A) Bright-field images show that the mycn mutants lacked swim bladder at 4 dpf but appeared at 5 dpf. All embryos are shown in lateral view. (B) Abnormal pharyngeal arch development was observed in mycn mutants via Alcian blue staining; images show the head region of WT and mycn mutant embryos at 5 dpf (ventral view). (C) Intestinal lumens in WT and mycn mutant embryos at 5 dpf shown by ET33J1: EGFP reporter (lateral view). (D) Fluorescence signals show the morphology of the whole intestines in WT and mycn mutant embryos at 7 dpf via DCFH-DA treatment (lateral view); statistical analysis of intestine length was showed in right. (E) Expression of shha and hand2 by WISH showing fin bud development in WT and mycn mutant embryos at 30 hpf (dorsal view). (F) Morphology of the whole intestine visualized via HE staining for the WT and mycn mutant embryo sections at 4 dpf. Black arrows indicate goblet cells in the WT intestines. Sections were cut along the sagittal plane. (G) Expression of ifabp by WISH showing intestines in WT and mycn mutant embryos at 3 dpf (dorsal view). (H) Diagram of the rescue plasmid construction. Overexpression of mycn specifically in endoderm cells was driven by sox17 promoter. (I) Expression of ifabp in WT (2 images on the left) and mycn mutant embryos (2 images on the right) at 3 dpf. The injected embryos are labeled with “inj” at the bottom of the image. Scale bars: 200 μm (A-F), 50 μm (G). The data underlying this figure can be found in S1 Data. DCFH-DA, 2′,7′-Dichlorodihydrofluorescein diacetate; dpf, days postfertilization; HE, hematoxylin–eosin; hpf, hours postfertilization; ifabp, intestine fatty acid–binding protein; WISH, whole mount in situ hybridization; WT, wild-type. |
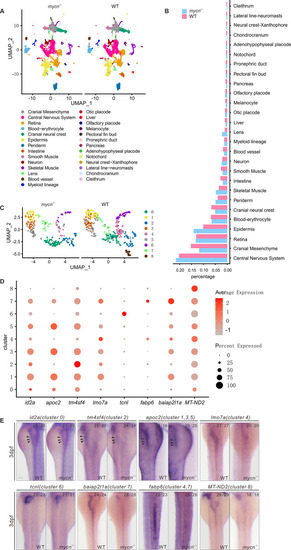
Single-cell RNA-seq analysis of WT and mycn mutant embryos at 3 dpf.
(A) Unsupervised clustering of cells in the mycn mutants and WT embryos at 3 dpf. Cells are colored according to their cell type annotations inferred from expressed marker genes and published datasets. (B) Bar plot shows the percentages of each cell type in mycn mutants (blue) or WT embryos (red). (C) UMAP plot shows the subclusters of intestinal cells selected from A. Cells are colored by cell type clusters. A total of 9 clusters were identified by unsupervised clustering. (D) Dot plot shows the expressions of marker genes in each subcluster of intestinal cells. Heatmap represents average expression level and dot size represents percentage of cell expression across mycn mutant and WT embryos. (E) WISH results show the expression of marker genes of each cluster: id2a (cluster 0), tm4sf4 (cluster 2), apoc2 (clusters 1, 3, and 5), lmo7a (cluster 4), tcnl (cluster 6), baiap2l1a (cluster 7), fabp6 (clusters 4 and 7), and MT-ND2 (cluster 8) in WT and mycn mutant embryos. Arrow heads indicate the intestines. Scale bar: 100 μm. dpf, days postfertilization; UMAP, uniform manifold approximation and projection; WISH, whole mount in situ hybridization; WT, wild-type. |

Detection of cell proliferation and apoptosis in intestines of WT and mycn mutant.
(A) Cell proliferation in the intestines was detected by PCNA immunofluorescence staining (green signal) of the tissue sections from the WT and mycn mutant embryos. The statistical analysis of the proliferating cells of the sections of intestine in the right. (B) Apoptosis in the intestines was detected via TUNEL assay (red signal) for the tissue sections from the WT, mycn mutant, and camptothecin-treated (as positive control) embryos. Sections were cut along the transverse plane. Dotted lines indicate the intestine positions. (C) Schematic representation of the experimental workflow of the flow cytometry analysis. (D) Cell proliferation in the intestines was detected by BrdU incorporation assay. (E) Apoptosis in the intestines was detected by APC-Annexin V staining. Embryos used in the flow cytometry analysis were descendants of ET33J1: EGFP reporter line crossed with WT or mycn mutants (D and E). Scale bar: 50 μm. PCNA, proliferating cell nuclear antigen; WT, wild-type. |
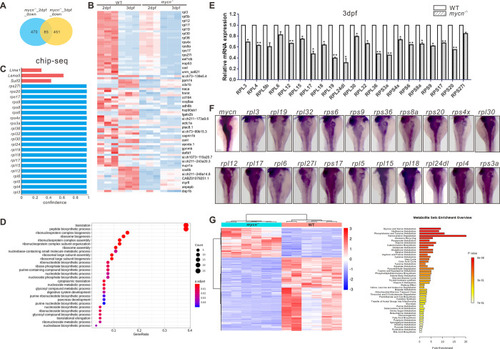
Multiomics analysis in the mycn mutant and WT embryos.
(A) Venn diagram of the down-regulated genes in mycn mutants compared with WT at 2 and 3 dpf. The number of congruently down-regulated genes is shown in the middle. (B) Heatmap showing the scaled expression patterns of 85 down-regulated genes (identified in A) in mycn mutant and WT embryos at 2 and 3 dpf. Color scale: red, high expression; blue, low expression. (C) Bar plot shows the confidence interval of a portion of the rpl and rps genes that were direct downstream targets of MYCN analyzed by ChIP-seq of MYCN in the mouse ESC from published datasets [31]. These genes were also been found down-regulated in the mycn mutants by bulk RNA-seq analysis. (D) Dot plot showing enriched GO terms of the 85 down-regulated genes in the mycn mutants. The size and color intensity of each dot represents the gene counts in each enriched GO term and the adjusted p-value, respectively. (E) qPCR verification of the down-regulated rpl and rps genes at 3 dpf in WT and mycn mutant embryos. Asterisks indicate that the significant difference by Student t test. **p < 0.001; *p < 0.05. (F) Expression patterns of rpl and rps genes and mycn in the digestive organs of WT embryos at 3 dpf via WISH (images shown in dorsal view). (G) Metabolite analysis of the mycn mutant and WT embryos. The heatmap shows the expressions of different substances in mycn mutant and WT embryos after normalizing the intensity value of each metabolite. Bar plot shows the KEGG pathway enrichment and enrichment significance calculated by analysis of differential metabolites between the mycn mutant and WT embryos. Fold enrichment is the ratio of the number of metabolites matching the pathway during enrichment analysis to the number of theoretical metabolites distributed to the pathway of random distribution. Enrichment significance is indicated by color in the histogram according to p-value. Scale bar: 100 μm. The data underlying this figure can be found in S1 and S2 Data. dpf, days postfertilization; ESC, embryonic stem cell; GO, gene ontology; WISH, whole mount in situ hybridization; WT, wild-type. |

Abnormal rRNA processing and impaired protein translation in mycn mutants.
(A) Northern blot analysis of mycn mutant and WT embryos at 5 dpf was performed using probe 5′ETS1, ITS1-1, and ITS2-1. Schematic drawing showing the structure of the pre-rRNA and probe positions of zebrafish (top) [34]. All samples were normalized by the total RNA. (B) Ribosomal profiling of mycn mutant and WT embryos at 3 dpf was performed by sucrose density–gradient centrifugation. All samples were normalized by the total RNA. (C) Detection of nascent protein synthesis by puromycin incorporation assay in WT and mycn mutant embryos at 2 and 3 dpf. Puromycin-incorporated neosynthesized proteins were detected by western blot with anti-puromycin antibody. The β-actin expression level was used as internal control. (D) Nascent protein synthesis was detected by section immunofluorescence with anti-puromycin antibody in WT and mycn mutant embryos at 3 dpf. Sections were cut along the transverse plane. All embryos are shown in dorsal view. Scale bar: 50 μm (C), 200 μm (D-F). Raw images of this figure are provided in S1 Raw Images. dpf, days postfertilization; WT, wild-type. |
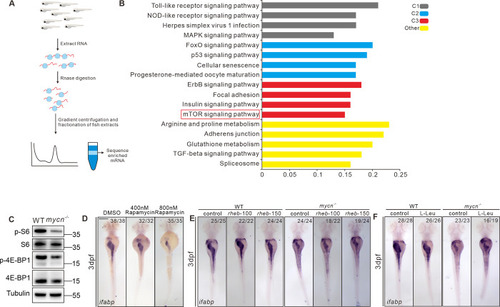
Blockage of mTOR pathway and impaired protein translation results to intestinal defects in mycn mutants.
(A) Schematic representation of the experimental workflow of the Ribo-seq. (B) KEGG analysis of the genes showing reduced translation efficiency in the mycn mutant. The red box marks the mTOR pathway. (C) Detection of the rps6, phosphorylated rps6, eIF4EBP, and phosphorylated eIF4EBP in WT and mycn mutant embryos at 3 dpf. The proteins were detected by western blot. The tubulin expression level was used as internal control. (D) Inhibiting the mTOR pathway by different doses of rapamycin mimicked the intestinal defects phenotype of the mycn mutants. (E, F) Activating the mTOR pathway by injecting rheb mRNA and L-Leu treatment partially rescued the intestinal defects phenotype of the mycn mutants. All embryos are shown in dorsal view. Scale bar: 50 μm (C), 200 μm (D-F). Raw images of this figure are provided in S1 Raw Images. dpf, days postfertilization; ifabp, intestine fatty acid–binding protein; WT, wild-type. |