
Fig 3
- ID
- ZDB-FIG-221105-3
- Publication
- Li et al., 2022 - Mycn regulates intestinal development through ribosomal biogenesis in a zebrafish model of Feingold syndrome 1
- Other Figures
- All Figure Page
- Back to All Figure Page
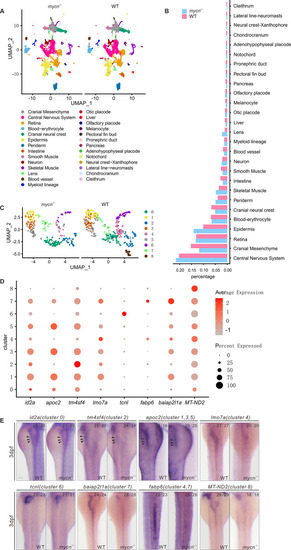
Single-cell RNA-seq analysis of WT and mycn mutant embryos at 3 dpf.
(A) Unsupervised clustering of cells in the mycn mutants and WT embryos at 3 dpf. Cells are colored according to their cell type annotations inferred from expressed marker genes and published datasets. (B) Bar plot shows the percentages of each cell type in mycn mutants (blue) or WT embryos (red). (C) UMAP plot shows the subclusters of intestinal cells selected from A. Cells are colored by cell type clusters. A total of 9 clusters were identified by unsupervised clustering. (D) Dot plot shows the expressions of marker genes in each subcluster of intestinal cells. Heatmap represents average expression level and dot size represents percentage of cell expression across mycn mutant and WT embryos. (E) WISH results show the expression of marker genes of each cluster: id2a (cluster 0), tm4sf4 (cluster 2), apoc2 (clusters 1, 3, and 5), lmo7a (cluster 4), tcnl (cluster 6), baiap2l1a (cluster 7), fabp6 (clusters 4 and 7), and MT-ND2 (cluster 8) in WT and mycn mutant embryos. Arrow heads indicate the intestines. Scale bar: 100 μm. dpf, days postfertilization; UMAP, uniform manifold approximation and projection; WISH, whole mount in situ hybridization; WT, wild-type. |