
Fig. 1
- ID
- ZDB-FIG-220908-90
- Publication
- Hui et al., 2022 - Regulatory T cells regulate blastemal proliferation during zebrafish caudal fin regeneration
- Other Figures
- All Figure Page
- Back to All Figure Page
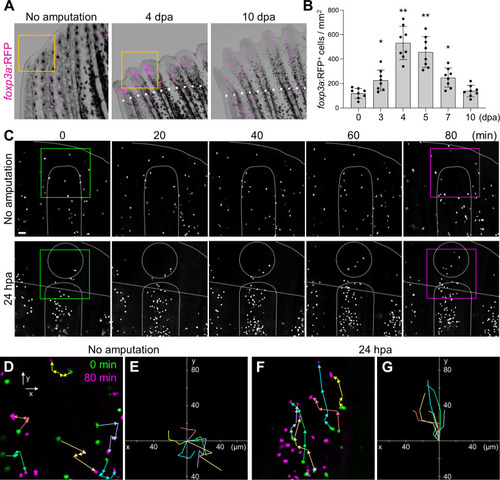
Amputation-induced infiltration of Tregs in the regenerating caudal fin tissue. (A) Spatio-temporal distribution of foxp3a:RFP+ Treg cells in the distal part of unamputated, 4 and 10 days post amputation (dpa) regenerating caudal fins. Dotted lines show the plane of amputation. Yellow box indicates the distal tip of unamputated fin or regenerating fin blastema. Bar, 200 µm. (B) Quantification of foxp3a:RFP+ cells in unamputated, 3, 4, 5, 7 and 10 dpa fins (mean ± SEM, n = 8, *P < 0.01, **P < 0.001, Mann–Whitney U test). (C) Time-lapse images of foxp3a:RFP+ cells in unamputated or 24 hours after amputation (hpa) of caudal fin. Dotted lines demarcate the distal tip, the bone, the blastema, and amputation planes. Bar, 20 µm. (D, F) Higher magnification fields of C in unamputated and 24 hpa fin respectively. foxp3a:RFP+ cells at 0 min and 80 min are indicated by green and magenta, respectively. Colored arrows correspond to the migratory tracks of each foxp3a:RFP+ cells in unamputated (D) and 24 hpa fin (F). Bar, 20 µm. (E, G) Combinatorial overlay of the 6 individual tracks of foxp3a:RFP+ cell in (D, F), respectively, and which were plotted after aligning their starting positions. Each crawling tracks display a migratory path for individual Treg cells. The traces shown in (D, F) are repositioned to the center to define the migratory path distance of each dot. Bar, 20 µm. |