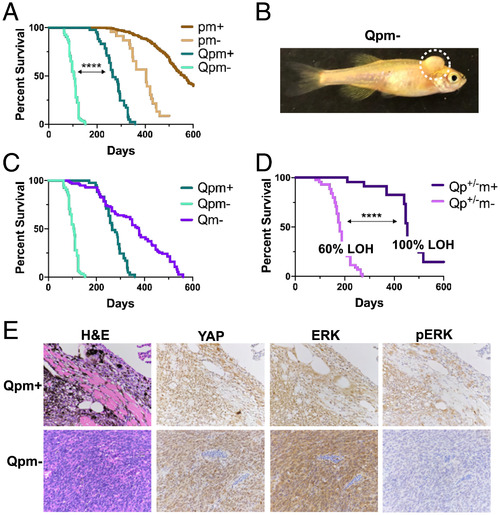
Mitfa loss accelerates GNAQQ209L-driven tumorigenesis, and resulting tumors stain negatively for hyperactive ERK; Q, Tg(mitfa:GNAQQ209L); p, tp53M214K/M214K; m+, mitfa+/+; m−, mitfa−/−; p+/−, tp53+/M214K. (A) Kaplan–Meier curves for the indicated genotypes show that overall survival of Tg(mitfa:GNAQQ209L)-expressing zebrafish was significantly decreased by mitfa deficiency (P < 0.0001, determined by log-rank test). The pm+ and pm− zebrafish develop MPNSTs, while Qpm+ and Qpm− zebrafish develop UMs and, less frequently, MPNSTs. (B) A representative image, with tumor outlined by dotted line, shows the typical unpigmented UM tumor phenotype of Qpm− zebrafish. (C) Kaplan–Meier curves show that mitfa−/− also cooperates with GNAQQ209L to decrease overall survival in a tp53-WT background. The Qpm+ and Qpm− curves from A are included for comparison. (D) Kaplan–Meier curves showing that Qp+/−m− zebrafish have significantly reduced survival compared to Qp+/−m+ counterparts (P < 0.0001, determined by log-rank test) as well as a reduced reliance on tp53 LOH, as determined by DNA sequencing of the mutation-bearing tp53 exon of excised tumors. (E) Representative images (n ≥ 3 for each stain and genotype) of hematoxylin and eosin (H&E) and IHC for YAP, ERK1/2, and phospho-ERK1/2 (pERK; active) for Qpm+ and Qpm− tumors. YAP activation was detected through nuclear localization.
|
