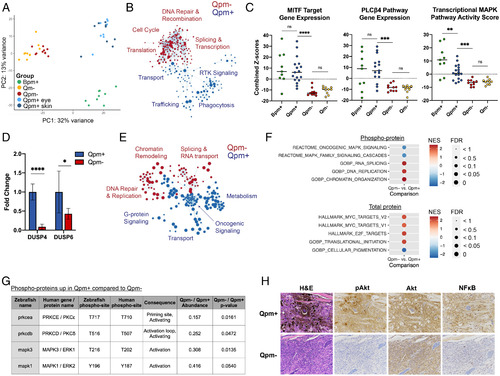
RNA sequencing and phospho-proteomics determine that Qpm− tumors are deficient in PLCβ4–PKCδ/ε signaling and up-regulate MYC target genes. Genotype abbreviations are as indicated in Fig. 1; B, Tg(mitfa:BRAFV600E). (A–C) RNA-sequencing data were generated for the following tumor numbers, genotypes, and tumor locations: 9 Bpm+, 8 Qpm+ eye, 9 Qpm+ skin, 10 Qpm−, and 10 Qm− (GSE190802). (A) PCA shows distinct clustering of Qpm+ tumors (regardless of their anatomical location), Qpm− and Qm− (regardless of tp53 status), and Bpm+. (B) Cytoscape enrichment map shows GSEA c2cp_Reactome data sets that were significantly enriched (false discovery rate [FDR] q value < 0.05) in Qpm− (red) versus Qpm+ (blue). Each circle denotes a gene set, circle size denotes the number of genes in each gene set, and clustering and line length is determined by similar genes within each gene set. Complete GSEA results are shown in Dataset S1. (C) For each individual Bpm+, Qpm+, Qpm−, and Qm− tumor, combined Z scores were calculated for the identified zebrafish orthologs for the MITF target gene (Left), PLCβ4 pathway (Middle), or MAPK transcriptional activity (Right) gene sets. The bar denotes the medians for each tumor type. Qpm− and Qm− tumors have significantly reduced expression compared with either Qpm+ or Bpm+ tumors in each of the three gene sets (P < 0.001, determined by Student’s unpaired t test). (D) qRT-PCR for the top two differentially expressed genes in the MAPK transcriptional activity gene set, DUSP4 and DUSP6, on new Qpm+ and Qpm− tumor samples (n = 6 each). Results are normalized to ACTB2 expression. Fold change is relative to the average of the Qpm+ samples, with error bars indicating SD. P < 0.0001 for DUSP4 and P = 0.033 for DUSP6, as determined by Student’s unpaired t test. (E–G) Phospho-peptides and total proteins from Qpm− and Qpm+ tumors (n = 5/genotype) were quantified by mass spectrometry, and GSEA was conducted (complete results are shown in Dataset S1. (E) Cytoscape enrichment map shows c2cp Reactome and c5 Biological Processes data sets significantly enriched (FDR q value < 0.05) in phospho-proteins from Qpm− (red) versus Qpm+ (blue) tumors. (F) Key gene sets identified as significantly different between Qpm− and Qpm+ for phospho-proteins (Top) or total protein (Bottom), demonstrating enrichment of MAPK signaling in Qpm+ and MYC and E2F targets in Qpm−; NES, normalized enrichment score. (G) Phospho-peptides associated with PKCδ, PKCε, ERK1, and ERK2 activation that were reduced in Qpm− compared to Qpm+. (H) Representative IHC images (from n ≥ 3 per stain and genotype) for phospho-Akt (p-AKT; active), total AKT, and NF-κB (with nuclear staining indicating the active form) show that Qpm− tumors are deficient for signaling from pathways other than MAPK downstream of PKC–RasGRP3.
|
