|
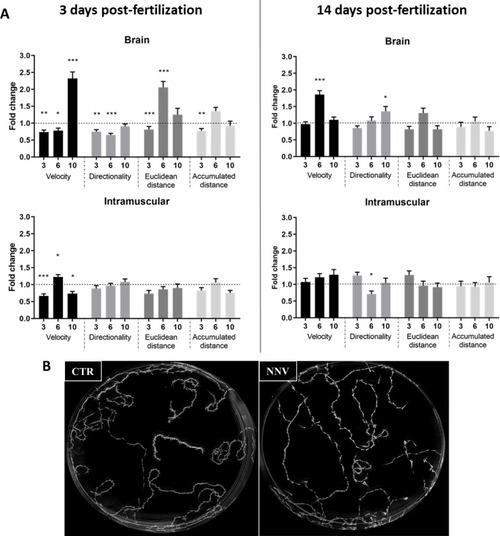
Image analysis of the swimming behavior of zebrafish larvae (3 and 14 dpf) infected with NNV via brain or IM. (A) Comparison of velocity, directionality, accumulated distance and Euclidean distance parameters between NNV-infected and the corresponding uninfected control larvae. Video tracking of zebrafish larvae was conducted at different times postinfection (3, 6, and 10 dpi). The fold change (FC) of infected larvae compared with their uninfected control (Control FC = 1, dotted lines) was calculated. The graphs represent the mean ± SEM of the biological replicates. Statistically significant differences are displayed as follows: ***, 0.0001 > p value > 0.001; **, 0.001 > p value > 0.01; *, 0.01 > p value > 0.05. (B) Example of maximal projection of the video recorded for 3-dpf larvae infected via brain and the corresponding controls at 6 dpi.
|