
FIGURE
Figure 8
Figure 8
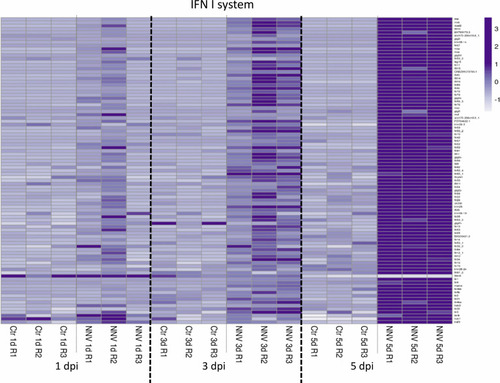
Heatmap representing the DEGs linked to the type I IFN system at 1, 3, and 5 dpi. A heatmap was constructed with the TPM expression values of the DEGs. Expression levels are represented as row-normalized values on a white–purple colour scale. |
Expression Data
Expression Detail
Antibody Labeling
Phenotype Data
Phenotype Detail
Acknowledgments
This image is the copyrighted work of the attributed author or publisher, and
ZFIN has permission only to display this image to its users.
Additional permissions should be obtained from the applicable author or publisher of the image.
Full text @ Front Immunol