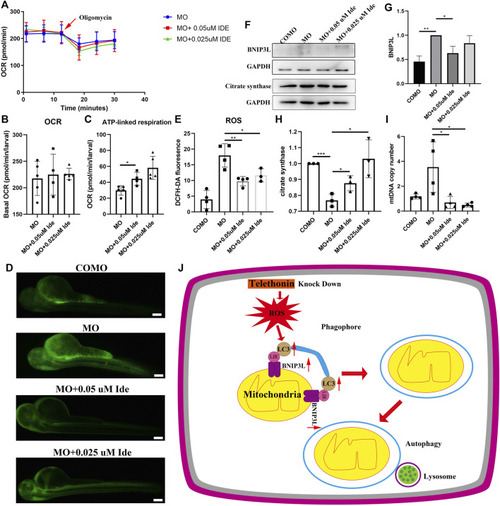
(A) OCR of MO subjects (n = 5), MO + 0.05uM Ide (n = 4), and MO + 0.025uM Ide (n = 5) zebrafish at 48 hpf. (B) Basal OCR of MO subjects (n = 5), MO + 0.05uM Ide (n = 4), and MO + 0.025uM Ide (n = 5) group. The data represent means ± S.D. (C) ATP-linked respiration was studied for all groups. The data represent means ± S.D. *p < 0.05. (D) Distribution of fluorescence visualizing ROS in COMO, MO, MO + 0.05uM Ide, and MO + 0.025uM Ide group in 48 hpf. (E) Fluorescence intensity of ROS. The data represent means ± S.D. *p < 0.05, **p < 0.01. (F) Western blot showing BNIP3L, and citrate synthase levels in control, LGMD2G zebrafish model and drug-treated LGMD2G zebrafish. (G,H) Quantification of western blot results from zebrafish. One-way ANOVA (Dunnett’s post hoc test) was used for comparisons with the MO, MO + 0.05 μM Ide, MO + 0.025 μM groups. An unpaired t test was used for comparisons with the MO and COMO groups. p < 0.05 (*), 0.001<p < 0.05 (**), p < 0.001 (***). (I) MtDNA copy number in COMO, MO, MO + 0.05 μM Ide, MO + 0.025 μM groups. Unpaired t test was used for comparisons. * Indicates p < 0.05. (J) Cartoon representation of mitophagy generation after tcap knockdown.
|
