FIGURE SUMMARY
Title

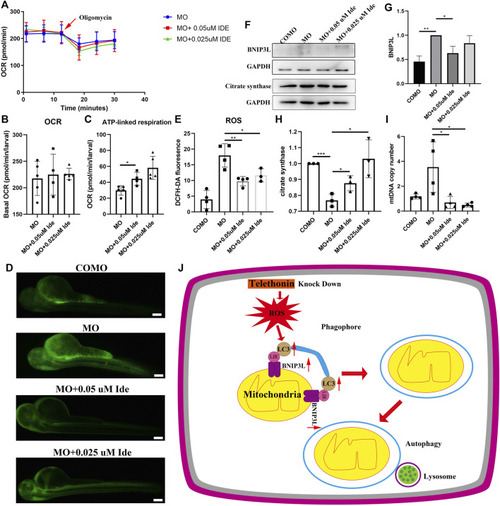
Tcap Deficiency in Zebrafish Leads to ROS Production and Mitophagy, and Idebenone Improves its Phenotypes

Authors
Lv, X., Zhang, R., Xu, L., Wang, G., Yan, C., Lin, P.
Source
Full text @ Front Cell Dev Biol

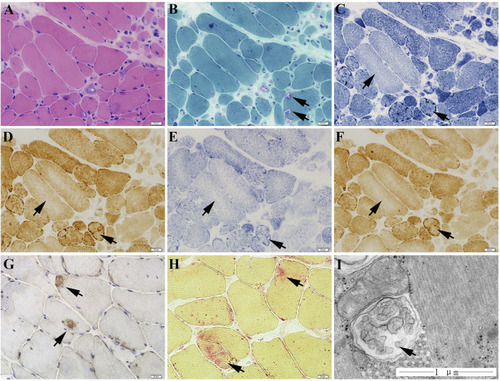
The muscle biopsy specimen from LGMD2G patient.
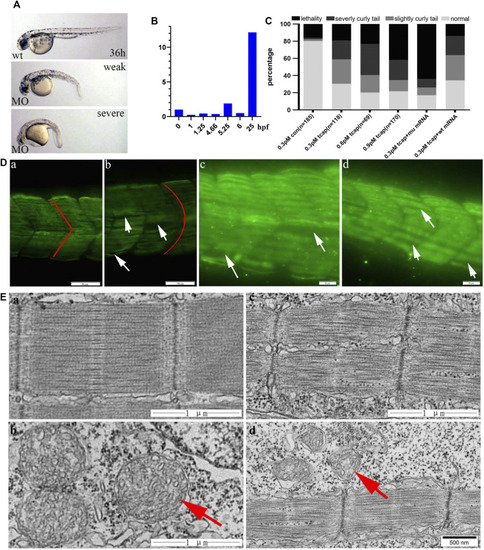
 (A) HE staining showed obvious variation in fiber size. (B) MGT staining showed scattered rimmed vacuoles. No ragged red fiber was found in MGT staining. (C–E) The presence of high enzyme activities for NADH (C), COX (D), and SDH (E) staining at the periphery of sarcoplasm and the decreased enzyme activities in the center of sarcoplasm. (F) No blue fibers in SDH-COX double staining. (G) P62 staining showed scattered P62-positive muscle fibers. (H) Increased acid phosphatase enzymatic activity (black arrows). (I) Ultrastructural examination and muscle pathology of patients with LGMD2G.

(A) MO-tcap results in specific phenotypes: images of 36 hpf wild-type zebrafish and weak and severe phenotypes of the LGMD2G zebrafish model. (B) Tcap is expressed at an early stage of embryonic development. (C) Dose-dependent effect of MO-Tcap. Coinjection of the wild-type human TCAP mRNA reduced the percentage of the animals with the phenotype at 0.3 pmol, while the mutant TCAP mRNA did not. (D) Tcap deficiency causes muscular dystrophy-like phenotypes. The anti-F59 antibody stained muscle fibers in green. COMO fish presented a V-shaped myoseptum and normal sarcomere architecture (red line in a). Tcap knockdown zebrafish exhibited a U-shaped myoseptum (red line in b) that was discontinuous or missing in some regions (white arrows in c and d), and the myofibers grew through adjacent somites. Scale bar, 20 mm. (E) Electron microscopy images of control zebrafish (a and b) and tcap knockdown zebrafish (c and d). Red arrows indicate normal mitochondria in b and dysmorphic mitochondria in d.

(A) Cartoon representation of how the Seahorse bioanalyzer displays mitochondrial bioenergetics. (B,C) OCR of control subjects (three zebrafish larvae in each group, four groups in total) and tcap knockdown zebrafish (four groups) at 5 hpf. The OCR of control subjects was significantly higher than that of tcap knockdown models of LGMD2G. An unpaired t test was used to compare the MO and COMO groups. * Indicates p < 0.05. (D,E) Comparison of OCR among control subjects (n = 4), tcap knockdown zebrafish with the slight phenotype (n = 4), and tcap knockdown zebrafish with the severe phenotype (n = 4). The OCR of control subjects was significantly higher than that of slightly curly tailed or severe curly tailed MO-tcap zebrafish. One-way ANOVA (Dunnett’s post hoc test) was used to compare the COMO, slightly curly tail, and severe curly tail groups; ****indicates p < 0.001. (F,G) ECR of control subjects (three zebrafish larvae in each group, four groups in total) and tcap knockdown zebrafish (four groups) at 5 hpf. The ECAR of control subjects was not significantly higher than that of tcap knockdown models of LGMD2G. An unpaired t test was used to compare the MO and COMO groups. (H,I) MtDNA copy number in patients with LGMD2G and control subjects (H) and tcap knockdown zebrafish and control zebrafish (I). Unpaired t test was used for comparisons. * Indicates p < 0.05.

(A,D,F) BNIP3L, LC3A, LAMP1 and citrate synthase expression in 48hpf zebrafish. (B,C,E,G) Quantification of western blot results from LGMD2G zebrafish models. Values are presented as the means ± SD of 3 separate experiments. Unpaired t test was used for comparisons. *Indicates p < 0.05.

EXPRESSION / LABELING:
Antibodies:
Fish:
Knockdown Reagent:
Anatomical Term:
Stage: Long-pec
PHENOTYPE:
Fish:
Knockdown Reagent:
Observed In:
Stage: Long-pec

(A) Design of the short-term phenotype assay in zebrafish. MO-tcap was injected into one-four cell stage embryos. Drug treatments were applied from 4 hpf. At 36 hpf, the phenotype was analyzed. (B) Graphic summary of the percentage of normal, slightly curly tail, severely curly tail, and lethality in different classes of LGMD2G zebrafish with or without idebenone treatment. (C) Body length analysis of different groups. One-way ANOVA (Dunnett’s post hoc test) was used to compare the MO, MO + 0.05 μM Ide, MO+0.025 μM groups. (D) Idebenone restored the body length of LGMD2G zebrafish. M + I, MO + idebenone. (E) Design of the short-term swimming activity assay in zebrafish: pairs of wild-type zebrafish were mated, and COMO and MO were injected into 1-4 cell stage embryos. Drug treatments were applied to the progeny in six-well plates (1 embryo per well) beginning at 2 dpf. At 5 dpf, a swimming activity assay was performed. (F) The locomotor activity settings for one cycle (15 min) of tracking are shown. (G) Representative heatmaps of swimming activity produced by DanioVision comparing COMO-injected, MO-injected, and MO-injected drug-treated fish over 15 min. Heatmap showing the tracking path of six zebrafish from each experimental group. The blue marks indicate the area the zebrafish passed through, and the depth of color represents the cumulative frequency of the tracking path. (H) Distance traveled by zebrafish from four different groups (COMO, MO, MO + 0.05 μM Ide, and MO + 0.025 μM Ide). One-way ANOVA (Dunnett’s post hoc test) was used for comparisons among the MO, MO+0.05 μM Ide, and MO+0.025 μM groups. An unpaired t test was used to compare the MO and COMO groups. p < 0.05 (*), 0.001 < p < 0.05 (**), p < 0.001 (***).

(A) OCR of MO subjects (n = 5), MO + 0.05uM Ide (n = 4), and MO + 0.025uM Ide (n = 5) zebrafish at 48 hpf. (B) Basal OCR of MO subjects (n = 5), MO + 0.05uM Ide (n = 4), and MO + 0.025uM Ide (n = 5) group. The data represent means ± S.D. (C) ATP-linked respiration was studied for all groups. The data represent means ± S.D. *p < 0.05. (D) Distribution of fluorescence visualizing ROS in COMO, MO, MO + 0.05uM Ide, and MO + 0.025uM Ide group in 48 hpf. (E) Fluorescence intensity of ROS. The data represent means ± S.D. *p < 0.05, **p < 0.01. (F) Western blot showing BNIP3L, and citrate synthase levels in control, LGMD2G zebrafish model and drug-treated LGMD2G zebrafish. (G,H) Quantification of western blot results from zebrafish. One-way ANOVA (Dunnett’s post hoc test) was used for comparisons with the MO, MO + 0.05 μM Ide, MO + 0.025 μM groups. An unpaired t test was used for comparisons with the MO and COMO groups. p < 0.05 (*), 0.001<p < 0.05 (**), p < 0.001 (***). (I) MtDNA copy number in COMO, MO, MO + 0.05 μM Ide, MO + 0.025 μM groups. Unpaired t test was used for comparisons. * Indicates p < 0.05. (J) Cartoon representation of mitophagy generation after tcap knockdown.

Acknowledgments
This image is the copyrighted work of the attributed author or publisher, and ZFIN has permission only to display this image to its users. Additional permissions should be obtained from the applicable author or publisher of the image. Full text @ Front Cell Dev Biol