
FIGURE
FIGURE 3
- ID
- ZDB-FIG-220403-48
- Publication
- Qian et al., 2022 - Single Cell Transcriptome Sequencing of Zebrafish Testis Revealed Novel Spermatogenesis Marker Genes and Stronger Leydig-Germ Cell Paracrine Interactions
- Other Figures
- All Figure Page
- Back to All Figure Page
FIGURE 3
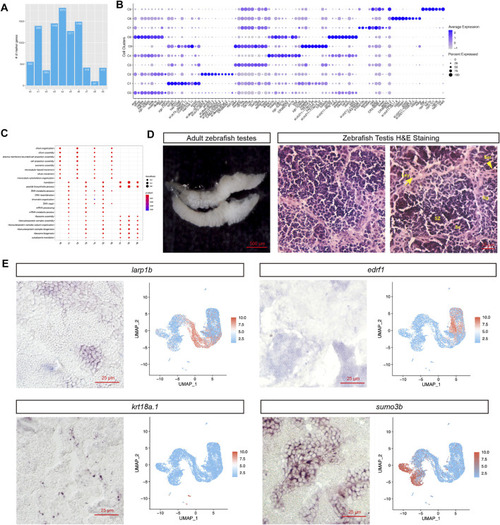
Studies of novel marker genes for each cell population. |
Expression Data
| Genes: | |
|---|---|
| Fish: | |
| Anatomical Terms: | |
| Stage: | Adult |
Expression Detail
Antibody Labeling
Phenotype Data
Phenotype Detail
Acknowledgments
This image is the copyrighted work of the attributed author or publisher, and
ZFIN has permission only to display this image to its users.
Additional permissions should be obtained from the applicable author or publisher of the image.
Full text @ Front Genet