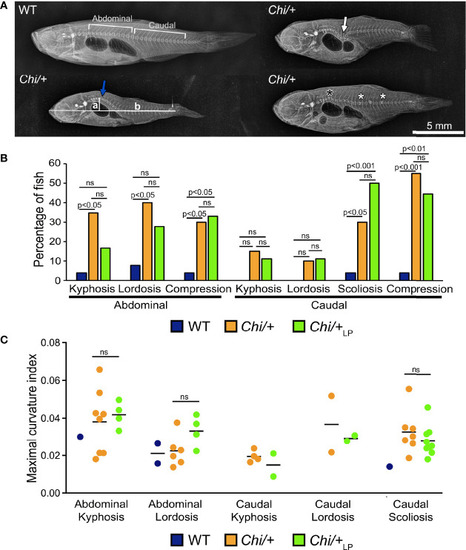
Vertebral column deformities in Chi/+ and Chi/+LP mutants. (A) Representative X-rays of three months old WT and Chi/+ (representative also for the malformations diagnosed in Chi/+LP) zebrafish show severe vertebral column deformities in mutants, i.e. abdominal kyphosis (blue arrow), abdominal lordosis (white arrow), vertebral body compressions (white asterisks) and hemivertebra (black asterisk). (B) Frequency of malformations. Chi/+ mutants (n=20) show increased frequency of kyphosis, lordosis, scoliosis and vertebral body compressions in the abdominal and caudal vertebral column compared to WT animals (n=26). Chi/+LP animals (n=18) display reduced kyphosis and lordosis of the abdominal, but increased scoliosis of the caudal vertebral column. Alterations were diagnosed based on Alizarin red S whole mount-stained specimens; only the abdominal and caudal region of the vertebral column were considered for the analysis. Chi-squared test followed by Bonferroni correction; p values are indicated; ns: non-significant. (C) Severity assessment of the maximal curvature index diagnosed in WT, Chi/+ and Chi/+LP related to abdominal kyphosis and lordosis, and to caudal kyphosis, lordosis and scoliosis. The graph shows individual data points and the mean value (black bar) for the maximal curvature index. The maximal kyphotic and lordotic indices were calculated in the sagittal plane of Alizarin red S stained specimens as the ratio (a/b) between the perpendicular distance from the axis (in correspondence of the maximal curvature, segment ‘a’ in A) and the standard length (segment ‘b’ in A). The same method but in the coronal plane was used to calculate the maximal scoliotic index. Mann-Whitney test was applied with a minimum of three values per group; ns, non-significant.
|
