
Fig. 3
- ID
- ZDB-FIG-220222-19
- Publication
- Binns et al., 2020 - Rational Design of Bioavailable Photosensitizers for Manipulation and Imaging of Biological Systems
- Other Figures
- All Figure Page
- Back to All Figure Page
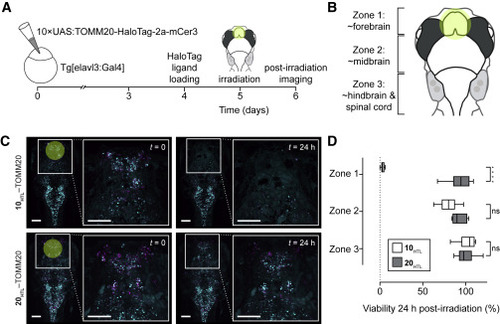
(A) Experimental scheme of larval zebrafish neuronal ablation experiment. (B) Cartoon of larval zebrafish brain “zones” used in this experiment; yellow circle indicates approximate area of irradiation. (C) Representative fluorescence microscopy images of zebrafish pre-irradiation (t = 0 min), and one day post-irradiation (t = 24 h) expressing HaloTag fusions to the mitochondrial protein TOMM20 (magenta) co-expressing mCerulean (cyan) and incubated with either JF570-HaloTag ligand (10HTL, top; 3 W/cm2 excitation) or JF585-HaloTag ligand (20HTL, bottom; 12 W/cm2). Scale bars, 100 μm. (D) Quantification of cell ablation efficacy using JF570-HaloTag ligand (10HTL) with JF585-HaloTag ligand (20HTL) as control; n = 6 for 10HTL experiments and n = 5 for 20HTL experiments; center line indicates median; box limits indicate upper and lower quartiles; whiskers indicate min-max; data analyzed via independent t tests. Statistical significance reported as follows: ∗p < 0.05, ∗∗p < 0.01, ∗∗∗p < 0.001, ∗∗∗∗p < 0.0001. See also Figure S4. |