
- Title
-
Rational Design of Bioavailable Photosensitizers for Manipulation and Imaging of Biological Systems
- Authors
- Binns, T.C., Ayala, A.X., Grimm, J.B., Tkachuk, A.N., Castillon, G.A., Phan, S., Zhang, L., Brown, T.A., Liu, Z., Adams, S.R., Ellisman, M.H., Koyama, M., Lavis, L.D.
- Source
- Full text @ Cell Chem Biol

(A) Relationship of classic photosensitizer chemical structures to parent fluorophores. Eosin (2) and Rose Bengal (3) are halogenated derivatives of fluorescein (1) and methylene blue (5) is a sulfur-containing analog of oxazine 1 (4). (B) Iodination of JF549 (6) to yield JF567 (7) and organolithium-mediated reaction of 8 and 9 to yield JF570 (10). (C and D) Normalized fluorescence excitation (ex) and emission (em) spectra of (C) 7 and (D) 10. (E) Table of photophysical properties for eosin (2), JF549 (6), JF567 (7), and JF570 (10). Notes: adata for 2 taken from (Fleming et al., 1977; Gandin et al., 1983; Seybold et al., 1969); bdata for 6 taken from (Grimm et al., 2015, 2017b); cϵmax measured in trifluoroethanol + 0.1% (v/v) trifluoroacetic acid; and dKL–Z measured in 1:1 (v/v) dioxane:water. |
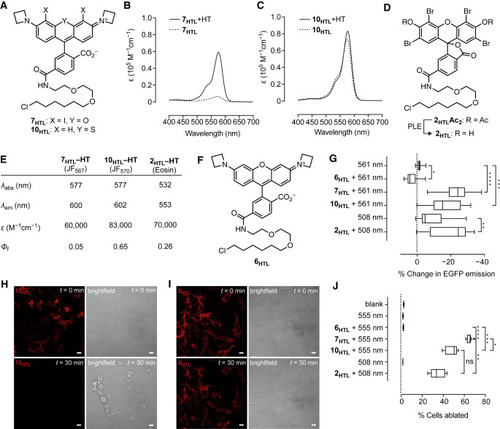
(A) Chemical structures of JF567-HaloTag ligand (7HTL) and JF570-HaloTag ligand (10HTL). (B and C) Absorbance spectra of (B) 7HTL and (C) 10HTL ± HaloTag protein (HT). (D) Chemical structure of eosin-Ac2-HaloTag ligand (2HTLAc2) and conversion to 2HTL by incubation with porcine liver esterase (PLE). (E) Table of photophysical properties for 7HTL, 10HTL, and 2HTL attached to HaloTag protein. (F) Chemical structure of JF549-HaloTag ligand (6HTL). (G) Comparison of EGFP CALI using 561 nm excitation light (laser; 10 W/cm2) alone (n = 19), 561 nm excitation light (laser; 10 W/cm2) with 6HTL (n = 15), 7HTL (n = 23), and 10HTL (n = 14), 508-nm centered excitation light (LED; 10 W/cm2) alone (n = 35), or 508-nm centered excitation light (LED; 10 W/cm2) with 2HTL (n = 30); center line indicates median; box limits indicate upper and lower quartiles; whiskers indicate min-max; data pooled from two experiments and analyzed via Kruskal-Wallis test with Steel-Dwass-Critchlow-Fligner post-hoc test. (H and I) Representative confocal fluorescence (561 nm laser excitation) and bright-field microscopy images of U2OS cells expressing HaloTag-TOMM20 fusion protein incubated with JF570-HaloTag ligand (10HTL) (H) or JF549-HaloTag ligand (6HTL) (I) before (t = 0 min) and after (t = 30 min) wide-field irradiation with 560-nm centered light. Scale bars, 13 μm. (J) Comparison of cell ablation efficacy using 6HTL, 7HTL, and 10HTL with 555 nm excitation light or 2HTL using 508-nm centered excitation light in U2OS cells stably expressing HaloTag-TOMM20 fusion protein exposed to 55 mW/cm2 excitation light for 3 min; center line indicates median; box limits indicate upper and lower quartiles; whiskers indicate min-max; data analyzed via Welch's ANOVA and Games-Howell post-hoc test (n = 5, 10.89 mm2 microplate wells); n = 5 except for blank measurement where n = 10. Statistical significance in (G and J) reported as follows: ∗p < 0.05, ∗∗p < 0.01, ∗∗∗p < 0.001, ∗∗∗∗p < 0.0001. |
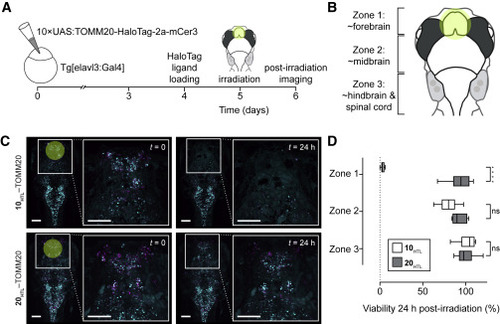
(A) Experimental scheme of larval zebrafish neuronal ablation experiment. (B) Cartoon of larval zebrafish brain “zones” used in this experiment; yellow circle indicates approximate area of irradiation. (C) Representative fluorescence microscopy images of zebrafish pre-irradiation (t = 0 min), and one day post-irradiation (t = 24 h) expressing HaloTag fusions to the mitochondrial protein TOMM20 (magenta) co-expressing mCerulean (cyan) and incubated with either JF570-HaloTag ligand (10HTL, top; 3 W/cm2 excitation) or JF585-HaloTag ligand (20HTL, bottom; 12 W/cm2). Scale bars, 100 μm. (D) Quantification of cell ablation efficacy using JF570-HaloTag ligand (10HTL) with JF585-HaloTag ligand (20HTL) as control; n = 6 for 10HTL experiments and n = 5 for 20HTL experiments; center line indicates median; box limits indicate upper and lower quartiles; whiskers indicate min-max; data analyzed via independent t tests. Statistical significance reported as follows: ∗p < 0.05, ∗∗p < 0.01, ∗∗∗p < 0.001, ∗∗∗∗p < 0.0001. See also Figure S4. |
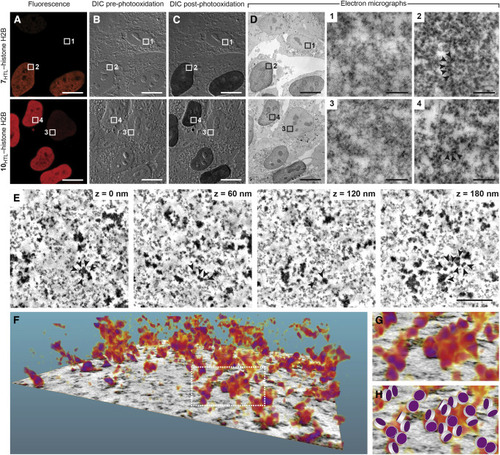
(A–D) Representative images of human osteosarcoma (HOS) cells expressing HaloTag-H2B fusion protein labeled with JF567-HaloTag ligand (7HTL; top) or JF570-HaloTag ligand (10HTL, bottom). (A) Pre-photooxidation fluorescence microscopy images. (B) Pre-photooxidation differential interference contrast (DIC) light microscopy images. (C) Post-photooxidation DIC light microscopy images. (D) TEM images post-photooxidation and OsO4 treatment of the entire field of view and regions of interest (ROIs) 1–4. ROIs 1 and 3 are from cells with low HaloTag-H2B expression and show low staining from DAB photooxidation and OsO4 treatment. ROIs 2 and 4 show increased electron density of the chromatin resulting from specific labeling of 7HTL or 10HTL and subsequent photooxidation of DAB and osmification; arrows highlight representative HaloTag-H2B-containing nucleosomes. Scale bars, 10 μm (A–D) and 200 nm (ROIs 1–4). (E) Representative electron tomogram slices in the nucleus of an HOS cell expressing HaloTag-H2B fusion proteins labeled with 10HTL, followed by photooxidization of DAB and osmification (cf. ROI 4). Arrows denote a cluster of nucleosomes in the volume. Scale bar, 200 nm. (F) 3D volumetric rendering extracted from the electron tomogram in (E). (G) Magnified view at the segmented chromatin denoted in (F). (H) Manual matching of stained nucleosomes in (G) with a simplified nucleosome structure consisting of a disc of 11 nm diameter and 5.5 nm height. These imaging experiments were duplicated with similar results. |