
Fig. 10
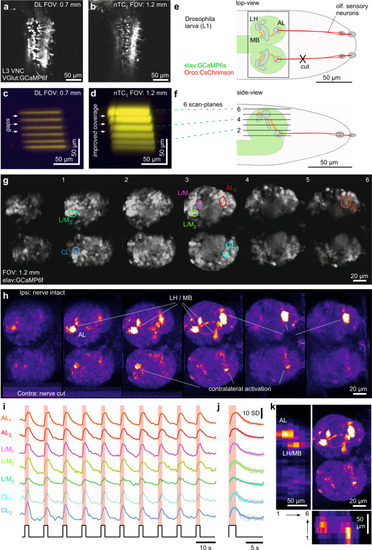
Multi-plane imaging and optogenetics for functional circuit mapping.
a, b, DL (a) and nTC1 (b) 1024 × 1024 px scans of the ventral nerve cord of a 3rd instar (L3) VGlut:GCamP6f Drosophila larva. c–f Scan-profiles taken in DL (c) and nTC1 (d) across 6 planes spaced ~15 µm apart. e, f Schematic of first instar (L1) elav:GCamP6s; Ocro:CsChrimson Drosophila larva from top (e) and side (f), with CsChrimson (red) and GCaMP6s (green) expression pattern and scan-planes indicated. g–k optogenetic circuit mapping of olfactory processing centres across the larval brain. Six scan planes (170 × 340 px each) were taken at 0.98 Hz/plane (i.e. volume rate) during the presentation of 587 nm light flashes (2 s) to activate CsChrimson in olfactory sensory neurons (OSNs). Brain anatomy (g) and false-colour coded fluorescence difference image (h 1–2 s after flash onset minus 1–2 s prior to flash onset), with fluorescence activity traces (i raw and j event triggered average). For a zoom-in on the antennal lobe in a different specimen, see also Fig. S5. k data from (h) summarised: top right: max-projection through the brain, with left and bottom showing transverse max-projections across the same data-stack. VNC, ventral nerve cord. AL, antennal lobe, L(H)/M(B), Lateral horn/Mushroom body, CL, Contralateral (antennal) lobe. |