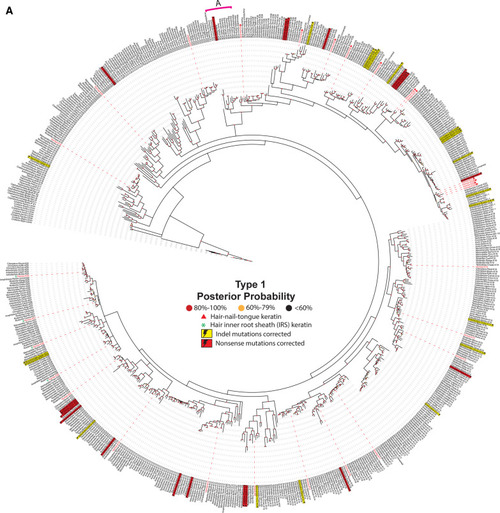
Evolution of animal keratins. Evolutionary relatedness in the type I (a) and II (b) keratin protein sequences from a broad representation of animal species, including human, was reconstructed. The 20 Phyla (or Classes or Orders) that were chosen include: Actinopterygii, ray-finned fishes; Amphibian, frogs-toads-salamanders; Arthropoda, insects-arachnids-millipedes-crusteaceans; Artiodactyla, ungulates (hoofed animals); Aves, birds; Cephalochordata, anphioxus; Cetacea, marine mammals; Chiroptera, bats & flying foxes; Chondrichthyes, cartilagenous fishes; Cnidaria, jellyfish; Coelacanthimorpha,, lobe-finned fishes with rudimenary legs; Crocodylia, crocodiles-alligators; Dipnoi, lungfish; Homo sapiens, modern-day humans; Hyperoartia, lampreys-eels; Marsupialia, kangaroos-wallaby-koalas-oppossums-wombats; Monotremata, platypus-echidna; Rodentia, mice-rats; Squamata, lizards-snakes; and Testudines, turtles, tortoise, terrapins. Protein sequences included in the reconstruction were identified by using the basic local alignment search tool (BLAST) on human keratin proteins against each non-redundant protein database for the clades of interest. For clades more distantly related evolutionarily to humans than Amphibia, only the protein with the highest similarity to human, as determined by the BLOSUM 62 matrix, was included. For Amphibia and clades more closely related to humans than amphibians, the top three proteins with the highest similarity to human—as determined by the BLOSUM 62 matrix—were used for analysis. Evolutionary relationships were inferred using MrBayes under a mixed amino acid model and visualized with the Interactive Tree-of-Life [accessed at itol.embl.de]. The dashed lines link the keratin proteins with their corresponding label. Human keratins are indicated by a red dashed line and red font. Known isoforms are denoted by the yellow boxes. Cnidaria was used as the root for both phylogenetic trees. Labels are written as follows: clades, species, protein name. The “PREDICTED: LOW QUALITY” proteins were labeled with their corrected mutations: yellow lightning bolt indicates insertion/deletion (indel), red lightning bolt indicates nonsense mutation. Clade A is indicated by a pink line. Nodes are colored to indicate posterior probabilities: red, 80–100%; yellow, 60–79%; black, < 60%. Details on the animal proteins represented in this phylogenetic tree are contained in Additional file 1: Table S1 and Additional file 2: Table S2 (for type I and type II respectively)
|
