
- Title
-
Update of the keratin gene family: evolution, tissue-specific expression patterns, and relevance to clinical disorders
- Authors
- Ho, M., Thompson, B., Fisk, J.N., Nebert, D.W., Bruford, E.A., Vasiliou, V., Bunick, C.G.
- Source
- Full text @ Hum. Genomics

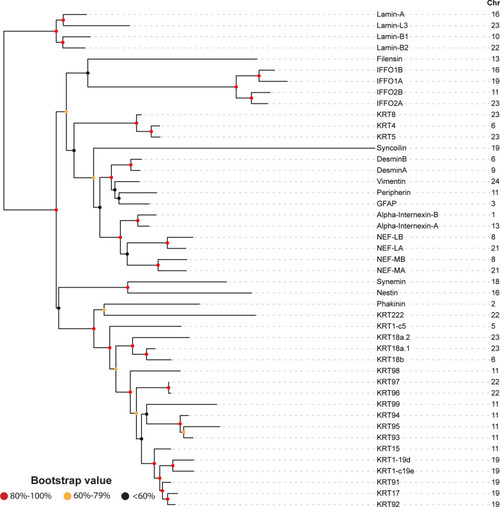
Rooted phylogenetic tree of the human (Homo sapiens) intermediate filaments (IntFils). Protein sequences of the 54 human IntFil types I, II, III, IV, V and VI were retrieved from the Human Intermediate Filament Database and aligned—using maximum likelihood ClustalW Phyml with bootstrap values presented at the node: > 80%, red; 60–79%, yellow; less than 60%, black. Branches of the phylogenetic tree are seen at left. The IntFil protein names are listed in the first column. Abbreviations: GFAP, glial fibrillary acidic protein; NEFL, NEFH, and NEFM correspond to neurofilaments L, H & M respectively; KRT, keratin proteins; IFFO1, IFFO2 correspond to Intermediate filament family orphans 1 & 2 respectively. The IntFil types are listed in the second column and are color-coded as follows: Type I, grey; Type II, blue; Type III, red; Type IV, gold; Type V, black; Type VI, green, and N/A, non-classified, pink. Chromosomal location of each human IntFil gene is listed in the third column. Known isoforms of synemin and lamin are denoted by the two yellow boxes |

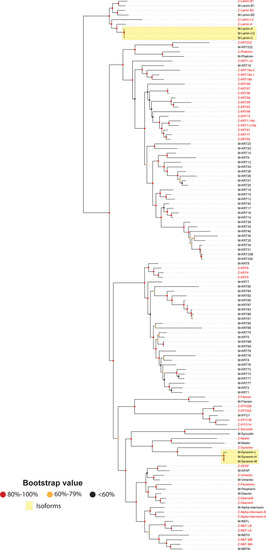
Phylogenetic tree of the inbred C57BL/6J mouse (Mus musculus) IntFil proteins. The same procedures were carried out here as described in the Fig. 1 legend. The IntFil protein names are listed in the first column. Abbreviations: GFAP, glial fibrillary acidic protein; NEFL, NEFH, and NEFM correspond to neurofilaments L, H & M respectively; KRT, keratin proteins; IFFO1 corresponds to IntFil family orphan 1; the evolutionarily most closely related to IFFO is filensin type VI. Chromosomal location of each mouse IntFil gene is listed in the second column. Known isoforms of lamin and synemin are denoted by the two yellow boxes |
Phylogenetic tree of the zebrafish (Danio rerio) IntFil proteins. The same procedures were carried out here as described in the Fig. 1 legend. The IntFil protein names are listed in the first column. Abbreviations: GFAP, glial fibrillary acidic protein; NEF-LA, NEF-LB, NEF-MA and NEF-MB correspond to neurofilaments LA, LB, MA & MB respectively; KRT, keratin proteins; IFFO1A, IFFO1B, IFFO2A & IFFO2B correspond to four IntFil family orphans. Chromosomal location of each IntFil gene is listed in the second column. KRT1-c5, KRT1-19d, and KRT1-c19e are keratin type I gene c5, 19d, and c19e respectively (they are not keratin 1) |
Phylogenetic tree of the zebrafish IntFil proteins superimposed on the mouse phylogenetic tree. Names of zebrafish proteins are in red font, mouse proteins in black font. The same procedures were carried out here, as described in the Fig. |
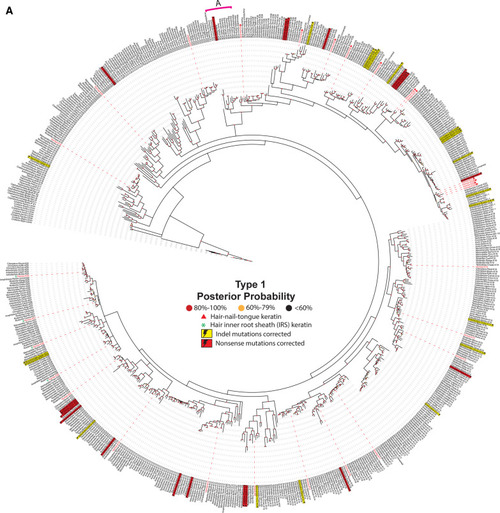
Evolution of animal keratins. Evolutionary relatedness in the type I ( |
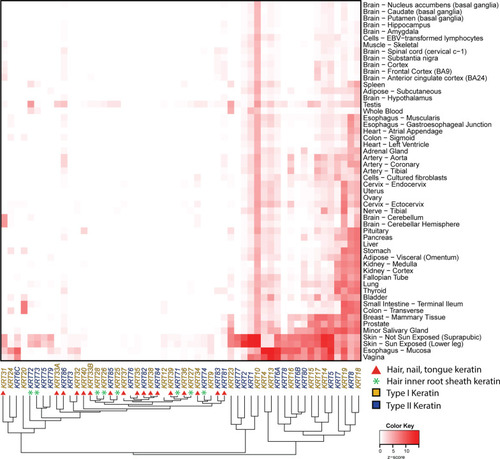
Tissue-specific keratin expression in adult human tissues. Median transcripts per million (TPM) expression values for keratin genes in 54 human tissues were retrieved from the GTEx database [53] and displayed as a heatmap—with keratin proteins listed across the bottom and human tissues on the Y-axis at right. The phylogenetic clustering of keratin gene expression is displayed along the X-axis at bottom. Data are logarithm base-10 (value + 1) transformed, scaled by row, and presented as a z-score with white tiles representing low or no expression and red tiles representing high expression. Keratin genes (columns) and human tissues (rows) were clustered using the maximum distance and complete clustering methods. Keratin genes are color-coded to indicate type I (gold) or type II (blue) keratin. Hair-nails-tongue keratin genes are denoted by a red circle. Hair-inner-root-sheath keratin genes are indicated by a green star |