
Fig. 6
- ID
- ZDB-FIG-220131-100
- Publication
- Ho et al., 2022 - Update of the keratin gene family: evolution, tissue-specific expression patterns, and relevance to clinical disorders
- Other Figures
- All Figure Page
- Back to All Figure Page
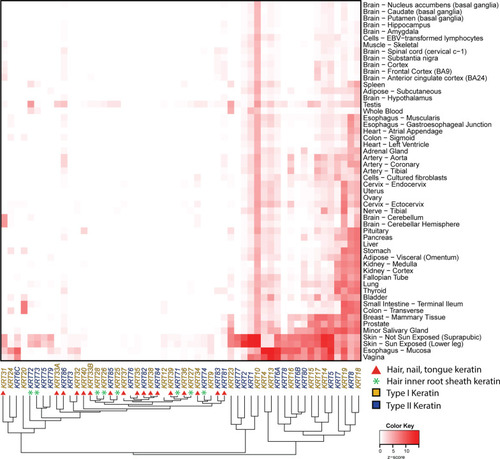
Tissue-specific keratin expression in adult human tissues. Median transcripts per million (TPM) expression values for keratin genes in 54 human tissues were retrieved from the GTEx database [53] and displayed as a heatmap—with keratin proteins listed across the bottom and human tissues on the Y-axis at right. The phylogenetic clustering of keratin gene expression is displayed along the X-axis at bottom. Data are logarithm base-10 (value + 1) transformed, scaled by row, and presented as a z-score with white tiles representing low or no expression and red tiles representing high expression. Keratin genes (columns) and human tissues (rows) were clustered using the maximum distance and complete clustering methods. Keratin genes are color-coded to indicate type I (gold) or type II (blue) keratin. Hair-nails-tongue keratin genes are denoted by a red circle. Hair-inner-root-sheath keratin genes are indicated by a green star |