
Fig. 5
- ID
- ZDB-FIG-220131-18
- Publication
- Vanoevelen et al., 2021 - DTYMK is essential for genome integrity and neuronal survival
- Other Figures
- All Figure Page
- Back to All Figure Page
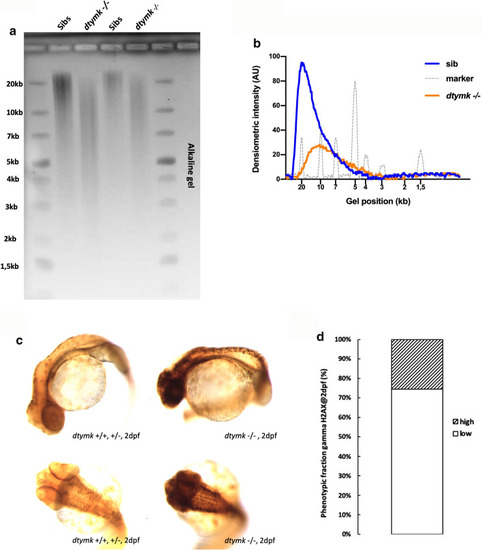
Ribonucleotide incorporation and DNA damage signaling. a Representative image of alkaline gel electrophoresis of genomic DNA. Genomic DNA of dtymk mutant embryos (dtymk –/–) and sibling (sibs) embryos at 5dpf was subjected to alkaline gel electrophoresis. The first two lanes contain 5 μg of genomic DNA of sibling (Sibs) and dtymk homozygous mutant (dtymk –/–) embryos, respectively. The following two lanes contain 2.5 μg of genomic DNA of sibling (Sibs) and dtymk homozygous mutant (dtymk –/–) embryos, respectively. The first and last lane contain the marker Generuler 1 kb Plus DNA ladder (Thermo Fisher). Three biological replicates produced highly similar results. b Quantification of alkaline gel electrophoresis. Densiometric intensity values of a line drawn from the slot to the bottom of the gel were determined using ImageJ and plotted as a function of distance in the gel. The genomic DNA of homozygous mutant (dtymk –/–) embryos, marked in orange, migrates at a lower molecular weight as the DNA of sibling embryos, marked in blue. Results indicate an increased sensitivity to alkaline hydrolysis of the genomic DNA of homozygous dtymk mutant (dtymk –/–) embryos. The position of the molecular weight marker is indicated by the grey line and its respective peaks corresponding to different molecular weights are indicated in the x-axis (gel position). c Representative images of side view (upper panels) and dorsal view (lower panels) of embryos at 2dpf showing sites of DNA-damage, visualized by γH2AX-staining (black dots). DNA damage was induced by UV-irradiation at 24hpf followed by a recovery time of 24 h. The left panels show sibling embryos (dtymk+/+, +/−) and the right panels show mutant (dtymk –/–) embryos. The mutant embryos clearly show many sites of unrepaired DNA-damage, whereas the sibling embryos hardly show any sites of DNA-damage. Embryos were imaged using identical camera and illumination settings. The scale bar represents 200 μm. d Quantification of the phenotypic fraction of embryos at 2dpf that show a high amount (high) vs. a low amount (low) of sites of DNA damage. The phenotypic fraction is consistent with the expected fraction of 25% as expected from a heterozygous incross of heterozygous dtymk fish. The genotype of the low vs. high phenotypic fraction was verified by Sanger sequencing. The number of embryos included in the analysis is n = 13 for embryos with high amounts of staining (dtymk mutants) and n = 38 for sibling embryos showing low to no γH2AX-staining. Two biological replicates produced similar results |