
- Title
-
DTYMK is essential for genome integrity and neuronal survival
- Authors
- Vanoevelen, J.M., Bierau, J., Grashorn, J.C., Lambrichs, E., Kamsteeg, E.J., Bok, L.A., Wevers, R.A., van der Knaap, M.S., Bugiani, M., Frisk, J.H., Colnaghi, R., O'Driscoll, M., Hellebrekers, D.M.E.I., Rodenburg, R., Ferreira, C.R., Brunner, H.G., van den Wijngaard, A., Abdel-Salam, G.M.H., Wang, L., Stumpel, C.T.R.M.
- Source
- Full text @ Acta Neuropathol.

Description of variants and clinical phenotype. a Overview of the dTTP biosynthesis pathway. DTYMK (dTMPK) mediates the penultimate step of the generation of dTTP. Both pathways: salvage pathway and de novo pathway converge before the enzymatic defect in DTYMK. Abbreviations used: DCK deoxycytidine kinase; TK1 thymidine kinase 1; TK2 thymidine kinase 2 (mitochondrial); DTYMK deoxythymidine (monophosphate) kinase; DNDPK deoxynucleotide diphosphate kinase; TS thymidylate synthase; RR ribonucleotide reductase; UMPS uridine monophosphate synthetase; CAD carbamoyl-phosphate synthase 2, aspartate transcarbamylase and dihydroorotase; TP thymidine phosphorylase. b Description of two families carrying variants in DTYMK. Both families share the variant c.242C>T which is homozygous in individual II and indicated in purple. Family I is compound heterozygous and contains the additional variant c.382G>A, indicated in red. Brain MRI and pictures showing microcephaly in both affected individuals. The age of the individuals at which the pictures were taken are 9 months and 26 months for individual I and individual II, respectively. MRI images of individual I at age 6 months and of individual II at 12 months. Both subjects show severe atrophy of the cerebral hemispheres and basal ganglia, whereas the thalamus, brain stem and cerebellum appear normal. Individual I also shows pronounced dilation of the lateral ventricles. c Position of the observed variants in the primary protein sequence of dTMPK and relative position of known functional domains are shown in the upper panel. The variants are labelled in purple (p.(Pro81Leu)) and red (p.Asp128Asn). Known functional domains of DTYMK are: P-loop motif (indicated in green, residues 13–21), DR(Y/H)-motif (yellow, residues 96–98), LID domain (blue, residues 135–150) [26]. In the lower panel, the position of the variants in the 3D structure (PDB code 1e2f) are depicted in purple (p.Pro81Leu) and red (p.Asp128Asn). d Evolutionary conservation of regions in dTMPK containing the described variants. The protein sequences used in the alignment are: H.sapiens: ENSP00000304802; S. cerevisiae: YJR057W; D. melanogaster: FBpp0303030; D. rerio: ENSDARP00000068373; A. carolinensis: ENSACAP00000000660; X. tropicalis: ENSXETP00000044270; G. gallus: ENSGALP00000053279; M. musculus: ENSMUSP00000027503 |
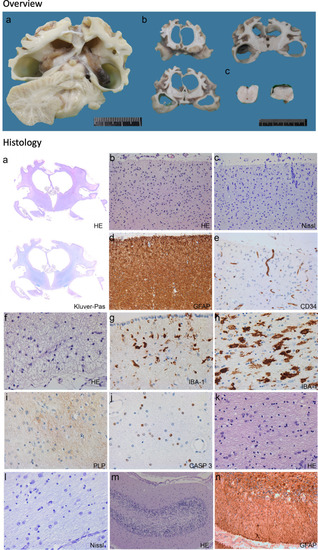
Neuropathology. Overview (upper) Panel. Macroscopic aspect of the brain of individual I. (a, b) Coronal cut through the cerebral hemispheres (a, b), cerebellum (a) and brainstem (c, pons on the left, medulla oblongata on the right). Histology (lower) panel. Microscopic aspect of the brain of individual I. a Whole mounts of the cerebral hemispheres confirm the massive degree of global atrophy (a, haematoxylin and eosin, HE) and show paucity of myelin throughout the cerebral hemispheres and capsules (Kluver-PAS). b–e Photomicrographs of the cerebral cortex from the frontal lobe show loss of neurons, including pyramidal cells (b, HE; c, Nissl stain for nuclei), astrogliosis (d, glial fibrillary acidic protein, GFAP) and minimal degree of vascular proliferation (e, CD34). f, g Photomicrographs of the deep white matter adjacent to the lateral ventricles show loss of oligodendrocytes (f, HE) and moderate activation of microglia (IBA-1). h–j The more peripheral hemispheric white matter shows massive activation of microglia with ameboid morphology (h, IBA-1), lack of myelin (i, proteolipid protein stain for myelin) and loss of oligodendrocytes by apoptosis (j, CASP3 stain for apoptotic cells). k, l Photomicrographs of the basal ganglia (k, HE) and thalamus (l, Nissl) show loss of neurons and reactive gliosis. m, n In the cerebellum, microscopic examination shows loss of neurons in the granular and Purkinje cell layer (m, HE) and moderate reaction of the Bergmann glia (n, GFAP) |
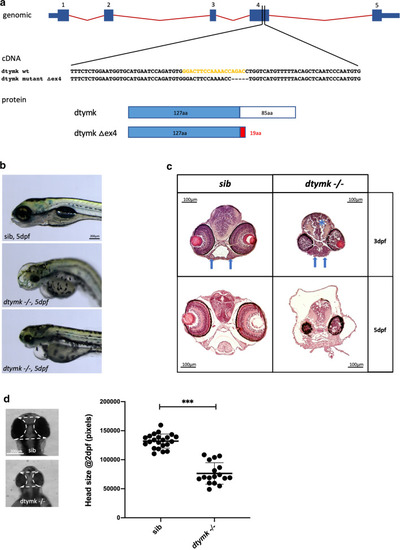
dtymk knockout zebrafish. a Genomic location of the gRNA sequence used to generate the knockout line of dtymk, indicated in yellow. The mutant line, Δex4 contains a 5-bp deletion in exon 4 resulting in a truncated protein. b Phenotype of dtymk knockout (dtymk –/–) embryos at 5dpf and their siblings (sib). The homozygous mutant embryos (dtymk –/–) show small, irregular eyes and edema around the brain, heart and intestine. The scale bar represents 200 μm. c Hematoxylin/eosin staining of transversal sections through the head of sibling and dtymk mutant embryos at 3dpf and 5dpf at the level, where the optic nerve exits the eye. Images show prominent degeneration of brain tissue (blue star) and structural abnormalities of the eyes and jaw cartilage structures (blue arrow) in the mutant embryos (dtymk –/–) which is absent in the sibling (sib) embryos. The scale bar represents 100 μm. d Quantification of head size in dtymk –/– and sibling (sib) embryos at 2dpf. Average head size of 19–24 embryos at 2dpf showing significant microcephaly in mutant vs. sibling embryos (***, p = 1.52 × 10⁻¹³). Error bars show the standard deviation. Two biological replicates. The scale bar represents 200 μm |
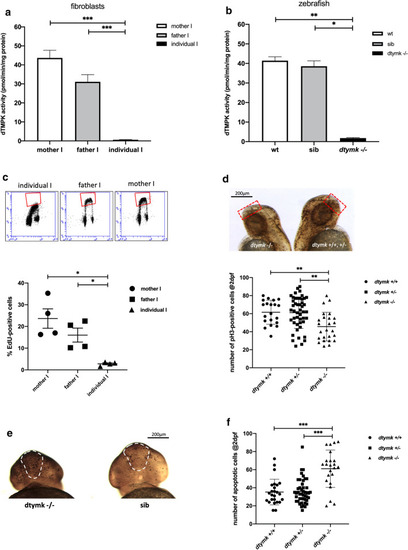
dTMPK activity and replication defects in fibroblasts and zebrafish. a dTMPK activity measured in fibroblasts of family I. In both parents, activity was readily detected and was lower in the fibroblasts of the father. dTMPK activity was hardly detectable in individual I (n = 6). Mother vs. individual I (***, p = 1.46 × 10⁻⁶, unequal variance). Father vs. individual I (***, p = 5.77 × 10⁻⁶, unequal variance). b dtmpk activity in lysates of zebrafish at 5dpf. Lysates were prepared from pools of 35–50 embryos of indicated genotypes. n = 2–3 and measurements were performed 2 times. dtmpk activity was negligible in mutant embryos and robustly detected in both sibling embryos as embryos of the same age from an unrelated wildtype strain (AB). Wt vs. mut: **, p = 0.0001); Sib vs. mut: *, p = 0.0028. c EdU incorporation in the fibroblasts of family I. Representative flow cytometry profiles are shown from fibroblasts of the individual and the parents. The red boxes denote the EdU positive (S-phase) cell populations. Quantification of the percentage of EdU-positive (S-phase) cells shows that the fibroblasts of individual I have significantly fewer proliferating cells when compared to the fibroblasts of the mother (*, p = 0.0180, unequal variance) and father (*, p = 0.0249, unequal variance). Indicated values are average % of EdU-positive cells ± SEM, n = 4). d Whole-mount pH3-immunostaining showing proliferating cells in wildtype (dtymk + / +), heterozygous (dtymk+/−) and dtymk-knockout (dtymk –/–) embryos at 2dpf. Representative images of side-view of an embryo with many proliferating cells (black dots, right image) and an embryo with less proliferating cells (left image). The red, dotted rectangle represents the area that was analyzed for the quantification of the number of proliferating cells in the forebrain. The scale bar represents 200 μm. Quantification of the number of pH3-positive cells in the brain indicates that the mutant embryos have significantly less pH3-positive cells in the brain when compared to wildtype (**, p = 0.0008) and heterozygous (**, p = 0.0004) embryos, n = 9–24 embryos per group, two biological replicates. Indicated values are average ± SEM. e Whole-mount TUNEL staining showing apoptotic cells in sibling (sib: dtymk+/+or dtymk+/−) and dtymk-knockout (dtymk –/–) embryos at 2dpf. Representative frontal images of an embryo with many apoptotic cells (black dots, left image, dtymk –/–) and an embryo with less apoptotic cells (right image, sib). The white, dashed area represents the forebrain, the area that was analyzed for the quantification of the number of apoptotic cells in the forebrain. Embryos were genotyped after staining and imaging. The scale bar represents 200 μm. f Quantification of the number of apoptotic cells in the forebrain in wildtype, heterozygous and dtymk-knockout embryos at 2dpf. The mutant embryos have significantly more (***, p < 0.0001) apoptotic cells in the forebrain when compared to wildtype (***, p = 6.45 × 10⁻⁶, equal variance) and heterozygous (***, p = 7.54 × 10⁻⁶, unequal variance) embryos, n = 23–46 embryos per group, two biological replicates. Indicated values are average ± standard deviation |
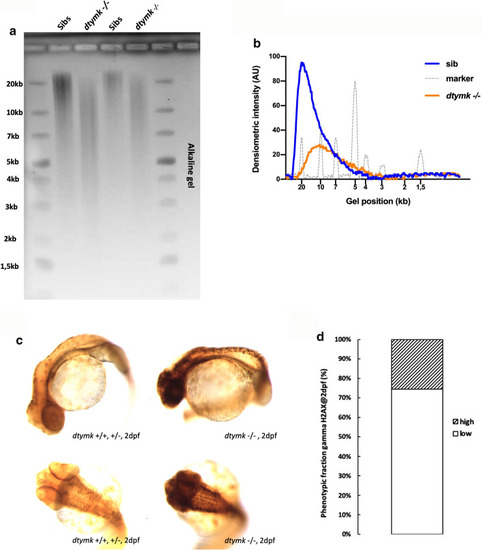
Ribonucleotide incorporation and DNA damage signaling. a Representative image of alkaline gel electrophoresis of genomic DNA. Genomic DNA of dtymk mutant embryos (dtymk –/–) and sibling (sibs) embryos at 5dpf was subjected to alkaline gel electrophoresis. The first two lanes contain 5 μg of genomic DNA of sibling (Sibs) and dtymk homozygous mutant (dtymk –/–) embryos, respectively. The following two lanes contain 2.5 μg of genomic DNA of sibling (Sibs) and dtymk homozygous mutant (dtymk –/–) embryos, respectively. The first and last lane contain the marker Generuler 1 kb Plus DNA ladder (Thermo Fisher). Three biological replicates produced highly similar results. b Quantification of alkaline gel electrophoresis. Densiometric intensity values of a line drawn from the slot to the bottom of the gel were determined using ImageJ and plotted as a function of distance in the gel. The genomic DNA of homozygous mutant (dtymk –/–) embryos, marked in orange, migrates at a lower molecular weight as the DNA of sibling embryos, marked in blue. Results indicate an increased sensitivity to alkaline hydrolysis of the genomic DNA of homozygous dtymk mutant (dtymk –/–) embryos. The position of the molecular weight marker is indicated by the grey line and its respective peaks corresponding to different molecular weights are indicated in the x-axis (gel position). c Representative images of side view (upper panels) and dorsal view (lower panels) of embryos at 2dpf showing sites of DNA-damage, visualized by γH2AX-staining (black dots). DNA damage was induced by UV-irradiation at 24hpf followed by a recovery time of 24 h. The left panels show sibling embryos (dtymk+/+, +/−) and the right panels show mutant (dtymk –/–) embryos. The mutant embryos clearly show many sites of unrepaired DNA-damage, whereas the sibling embryos hardly show any sites of DNA-damage. Embryos were imaged using identical camera and illumination settings. The scale bar represents 200 μm. d Quantification of the phenotypic fraction of embryos at 2dpf that show a high amount (high) vs. a low amount (low) of sites of DNA damage. The phenotypic fraction is consistent with the expected fraction of 25% as expected from a heterozygous incross of heterozygous dtymk fish. The genotype of the low vs. high phenotypic fraction was verified by Sanger sequencing. The number of embryos included in the analysis is n = 13 for embryos with high amounts of staining (dtymk mutants) and n = 38 for sibling embryos showing low to no γH2AX-staining. Two biological replicates produced similar results |
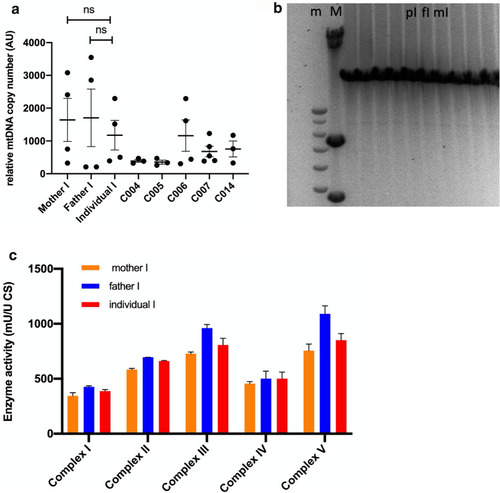
Mitochondrial DNA copy number, integrity and complex activity. a Relative mtDNA copy number in fibroblasts of individual I, the parents of individual I and 5 healthy controls. mtDNA copy number was assessed by comparing expression levels of a mitochondrial DNA fragment (D-loop) versus a nuclear encoded gene (B2M). Relative mtDNA copy number was calculated by calculating ΔCT (= CT nuclear gene, B2M–CT mitochondrial gene, D-loop) and converting ΔCT to relative expression levels (relative expression = 2∆CT) [31]. Results are pooled values from 4 experiments and plotted as average ± SEM. b MtDNA integrity by long-range PCR. Lane 1 and 2 contain DNA ladders (m); 1 kb Plus ladder and (M); HindIII-digested λDNA fragments ladder, respectively. Lanes 3–6 contain anonymized diagnostic samples, lane 7 contains the sample of individual I, lane 8 the father of individual I and lane 9 the mother of individual I. Lane 10–12 also contain anonymized diagnostic samples. This procedure is a diagnostic test, performed at Clinical Genetics at Maastricht UMC + . No large mtDNA deletions could be observed. c Mitochondrial respiratory complex activity. Enzymatic activity of mitochondrial respiratory complexes I–V were measured using a spectrophotometer in lysates of cultured fibroblasts [33]. Relative values are calculated using the value of Citrate Synthase activity as the reference value. Bars are averages of 2 measurements. This assay is a diagnostic assay, performed at the Translational Metabolic Laboratory of Radboud UMC |