
Fig. 4
- ID
- ZDB-FIG-220131-16
- Publication
- Vanoevelen et al., 2021 - DTYMK is essential for genome integrity and neuronal survival
- Other Figures
- All Figure Page
- Back to All Figure Page
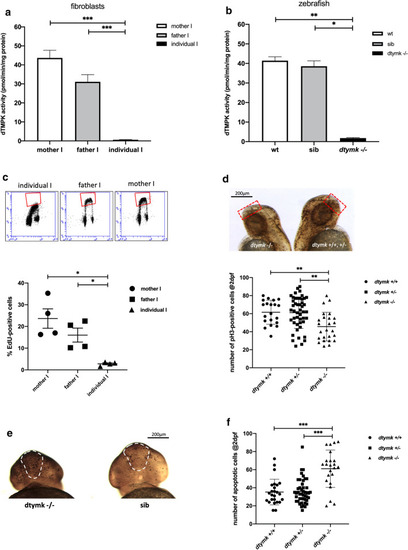
dTMPK activity and replication defects in fibroblasts and zebrafish. a dTMPK activity measured in fibroblasts of family I. In both parents, activity was readily detected and was lower in the fibroblasts of the father. dTMPK activity was hardly detectable in individual I (n = 6). Mother vs. individual I (***, p = 1.46 × 10⁻⁶, unequal variance). Father vs. individual I (***, p = 5.77 × 10⁻⁶, unequal variance). b dtmpk activity in lysates of zebrafish at 5dpf. Lysates were prepared from pools of 35–50 embryos of indicated genotypes. n = 2–3 and measurements were performed 2 times. dtmpk activity was negligible in mutant embryos and robustly detected in both sibling embryos as embryos of the same age from an unrelated wildtype strain (AB). Wt vs. mut: **, p = 0.0001); Sib vs. mut: *, p = 0.0028. c EdU incorporation in the fibroblasts of family I. Representative flow cytometry profiles are shown from fibroblasts of the individual and the parents. The red boxes denote the EdU positive (S-phase) cell populations. Quantification of the percentage of EdU-positive (S-phase) cells shows that the fibroblasts of individual I have significantly fewer proliferating cells when compared to the fibroblasts of the mother (*, p = 0.0180, unequal variance) and father (*, p = 0.0249, unequal variance). Indicated values are average % of EdU-positive cells ± SEM, n = 4). d Whole-mount pH3-immunostaining showing proliferating cells in wildtype (dtymk + / +), heterozygous (dtymk+/−) and dtymk-knockout (dtymk –/–) embryos at 2dpf. Representative images of side-view of an embryo with many proliferating cells (black dots, right image) and an embryo with less proliferating cells (left image). The red, dotted rectangle represents the area that was analyzed for the quantification of the number of proliferating cells in the forebrain. The scale bar represents 200 μm. Quantification of the number of pH3-positive cells in the brain indicates that the mutant embryos have significantly less pH3-positive cells in the brain when compared to wildtype (**, p = 0.0008) and heterozygous (**, p = 0.0004) embryos, n = 9–24 embryos per group, two biological replicates. Indicated values are average ± SEM. e Whole-mount TUNEL staining showing apoptotic cells in sibling (sib: dtymk+/+or dtymk+/−) and dtymk-knockout (dtymk –/–) embryos at 2dpf. Representative frontal images of an embryo with many apoptotic cells (black dots, left image, dtymk –/–) and an embryo with less apoptotic cells (right image, sib). The white, dashed area represents the forebrain, the area that was analyzed for the quantification of the number of apoptotic cells in the forebrain. Embryos were genotyped after staining and imaging. The scale bar represents 200 μm. f Quantification of the number of apoptotic cells in the forebrain in wildtype, heterozygous and dtymk-knockout embryos at 2dpf. The mutant embryos have significantly more (***, p < 0.0001) apoptotic cells in the forebrain when compared to wildtype (***, p = 6.45 × 10⁻⁶, equal variance) and heterozygous (***, p = 7.54 × 10⁻⁶, unequal variance) embryos, n = 23–46 embryos per group, two biological replicates. Indicated values are average ± standard deviation |