
FIGURE
Fig. 6
- ID
- ZDB-FIG-211230-112
- Publication
- Yuan et al., 2021 - Effects of sulfometuron-methyl on zebrafish at early developmental stages
- Other Figures
- All Figure Page
- Back to All Figure Page
Fig. 6
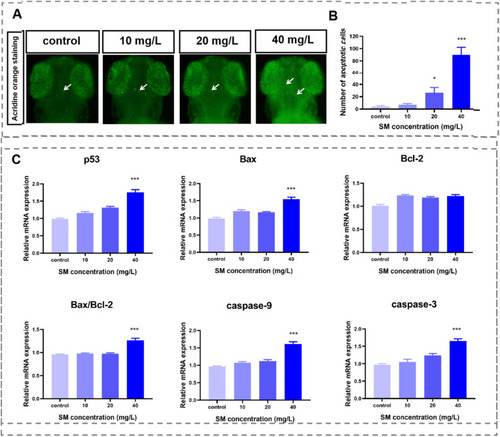
Apoptosis analysis after SM exposure at 72 hpf. (A) Representative images of apoptotic cells dyed with acridine orange in the head, as indicated by white arrows (n = 6). (B) Statistical analysis of the apoptotic cells in the larval heads after SM exposure. (C) The expression patterns of apoptosis-related genes p53, Bax, Bcl-2, Bax/Bcl-2, caspase-9, and caspase-3. Asterisks (*P < 0.05, **P < 0.01, ***P < 0.001) show significant differences between the control and exposure groups. |
Expression Data
Expression Detail
Antibody Labeling
Phenotype Data
Phenotype Detail
Acknowledgments
This image is the copyrighted work of the attributed author or publisher, and
ZFIN has permission only to display this image to its users.
Additional permissions should be obtained from the applicable author or publisher of the image.
Full text @ Ecotoxicol. Environ. Saf.