
- Title
-
Effects of sulfometuron-methyl on zebrafish at early developmental stages
- Authors
- Yuan, W., Xu, Z., Wei, Y., Lu, W., Jia, K., Guo, J., Meng, Y., Peng, Y., Wu, Z., Zhu, Z., Ma, F., Wei, F., Tian, G., Liu, Z., Luo, Q., Ma, J., Zhang, H., Liu, W., Lu, H.
- Source
- Full text @ Ecotoxicol. Environ. Saf.
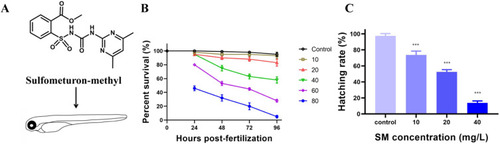
Developmental toxicity of sulfometuron-methyl in zebrafish embryos. (A) The formula of sulfometuron-methyl and toxicity testing in zebrafish. (B) Survival rate of embryos at 24, 48, 72, and 96 hpf. (C) Hatching rate of larvae at 72 hpf. Data are represented as mean ± S.D.; *p < 0.05, **p < 0.01, ***p < 0.001 vs vehicle (Dunnett's test). |

Immunotoxicity of sulfometuron-methyl in early development of zebrafish. (A) Neutrophils in CHT region of Tg (lyz:DsRed) indicated by white arrows in the white rectangle. (B) Neutrophils in CHT region stained by Sudan black indicated by white arrows in the black rectangle. (C, D) Quantitative analysis of the neutrophil number of figure A and B, respectively. (E) Macrophages in the head marked by neutral red staining. (F) Quantitative analysis of the macrophage number of figure E. All data are represented as mean±S.D. (n = 10 zebrafish larvae). Bars with different letters are significantly different (One-way ANOVA: *P < 0.05, **P < 0.01, ***P < 0.001). |
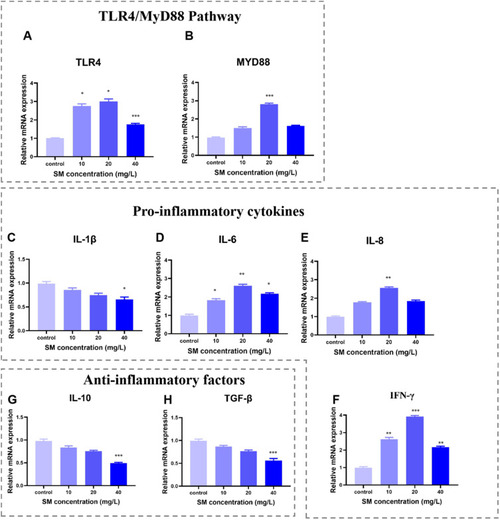
Changes in the mRNA expression of immune-related genes after SM exposure. (A) TLR4; (B) MYD88; (C) IL-1β; (D) IL-6; (E) IL-8; (F) IFN-γ; (G) IL-10; (H) TGF-β. Experiments were performed in triplicate and data is presented as mean ± S.D. (n = 3). Asterisks (*P < 0.05, **P < 0.01, ***P < 0.001) denote significant differences between the control and exposure groups. |
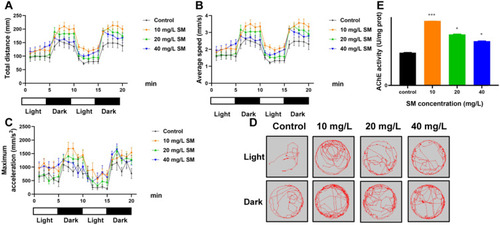
SM affected the locomotor behavior of larval zebrafish under light-dark transitions. (A) Total distance of zebrafish under light and dark stimulation cycle. (B) Average speed. (C) Maximum acceleration. (D) Representative locomotion tracking in light and dark conditions. (E) AChE activity. Asterisks (*P < 0.05, **P < 0.01, ***P < 0.001) show significant differences between the control and exposure groups. |

SM induced oxidative stress in the early stages of development. (A) Representative images of the production of ROS stained by DCFH-DA (n = 6). (B, C, and D) Effects of SM-treatment zebrafish on the SOD and CAT activities as well as MDA level, respectively (n = 3). Data are represented as mean ± S.D.; *p < 0.05, * *p < 0.01, * **p < 0.001 vs vehicle (Dunnett's test). |
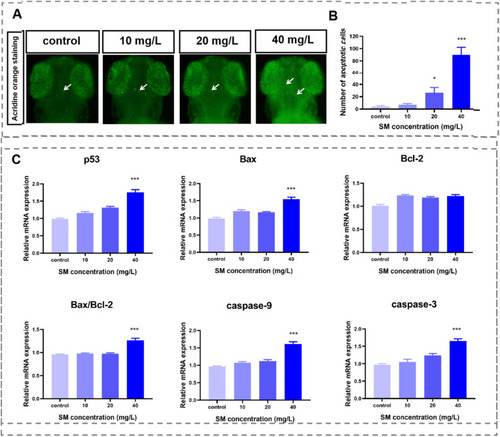
Apoptosis analysis after SM exposure at 72 hpf. (A) Representative images of apoptotic cells dyed with acridine orange in the head, as indicated by white arrows (n = 6). (B) Statistical analysis of the apoptotic cells in the larval heads after SM exposure. (C) The expression patterns of apoptosis-related genes p53, Bax, Bcl-2, Bax/Bcl-2, caspase-9, and caspase-3. Asterisks (*P < 0.05, **P < 0.01, ***P < 0.001) show significant differences between the control and exposure groups. |