
Fig. 7
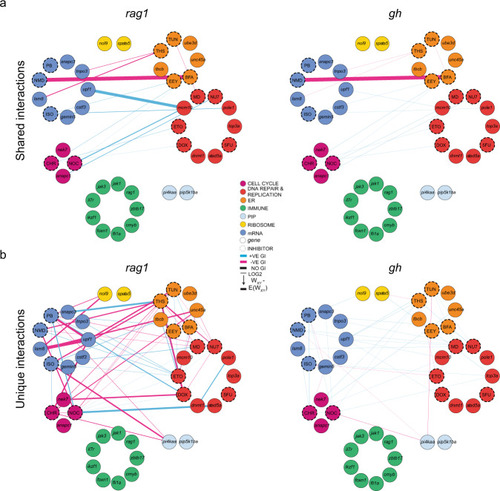
a Shared genetic interactions between mutant genes and inhibitors affecting fitness of both T cells (rag1) and growth hormone-producing somatotropic cells (gh). Line font size reflects relative log2-fold changes between observed and expected double mutant fitness values. Nodes are grouped by primary biological pathways that are affected by mutations or inhibitors. Solid or dashed circles around each node denote either genes or inhibitors, respectively. For this presentation, positive–suppressive and positive–coequal interactions are combined. Colours represent interaction types (magenta, negative; blue, positive; black, non-interactive). 5FU 5-fluorouracil), BFA brefeldin A, CHR Chr-6494, DOX doxorubicin, EEY eeyarestatin, ETO etoposide, ISO isoginkgetin, MD mitoxantrone dihydrochloride, NMD NMD14, NOC nocodazole, NU7 NU7026, PB pladienolide B, THS thapsigargin, and TUN tunicamycin. b, Cell type-specific genetic interactions between mutant genes and inhibitors specifically affecting fitness of T cells. |