
Fig. 8
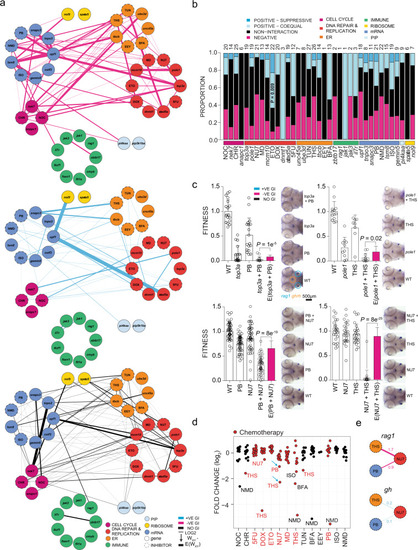
a Genetic interactions between genes and inhibitors affecting fitness of T cells (rag1) normalized to fitness of growth hormone-producing somatotropic cells (gh). Line font size reflects relative log2 fold-changes between observed and expected double-mutant fitness values for rag1/gh ratios. Nodes are grouped by primary biological pathways affected by mutation or inhibitor. Solid or dashed circles around each node denote either genes or inhibitors, respectively. For this presentation, positive–suppressive and positive–coequal interactions are combined. Colours represent interaction types (magenta, negative; blue, positive; black, non-interactive). b Proportions of interaction types by genes and inhibitors, grouped by biological functional categories. The number of interactions per node, including non-interaction, is depicted atop each bar. P values for genetic interaction type composition deviating from the average of all interactions were determined by Fisher’s exact test. c rag1/gh ratios (fitness) normalized to wild-type for genetic variants and inhibitor treatments. The observed double mutant fitness values are compared to the expected double mutant fitness values (E); negative genetic interactions between ER–mRNA processing and ER–DNA are independent of experiment types (mutant–inhibitor or inhibitor–inhibitor). P values were determined by two-tailed Student’s t-test. d Genetic interaction between inhibitors affecting fitness of T cells. Relative log2-fold changes between observed and expected double mutant fitness values for rag1/gh ratios. Inhibitor combinations denoted with blue arrow were tested in adolescent fish and in the tumour model. e Discordant cell type-specific genetic interactions between inhibitors affecting fitness of T cells (rag1) and growth hormone-producing somatotropic cells (gh). The identification of cell type-specific strongly negative interactions informs choices for in vivo treatment of T-ALL. 5FU 5-fluorouracil, BFA brefeldin A, CHR Chr-6494, DOX doxorubicin, EEY eeyarestatin, ETO etoposide, ISO isoginkgetin, MD mitoxantrone dihydrochloride, NMD NMD14, NOC nocodazole, NU7 NU7026, PB pladienolide B, THS thapsigargin, and TUN tunicamycin. |