
FIGURE
Fig. 4
Fig. 4
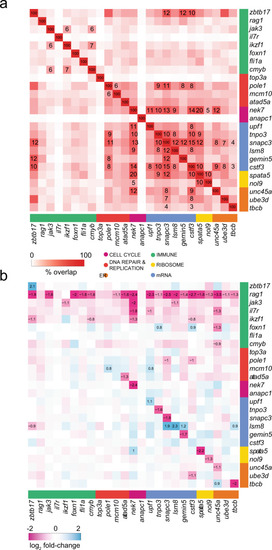
a Overlaps of top 1500 DEG (FDR ≤ 0.05) from each genetic variant grouped by functional categories. Only Jaccard indices with significant overlap (FDR ≤ 0.05), determined using the hypergeometric distribution, are shown; cell notes indicate the percentages of overlap. b Co-regulation of genes identified in the ENU screens. Genetic variants are shown in columns and their expression levels are depicted in rows; genes are grouped by functional categories. Cell notes identify genes with |log2 fold change | ≥ 0.5 and FDR ≤ 0.05. |
Expression Data
Expression Detail
Antibody Labeling
Phenotype Data
Phenotype Detail
Acknowledgments
This image is the copyrighted work of the attributed author or publisher, and
ZFIN has permission only to display this image to its users.
Additional permissions should be obtained from the applicable author or publisher of the image.
Full text @ Commun Biol